by Huang G. et al., Nov 2021 in PrecambrianResearch
It is widely accepted that atmospheric pO2 < 1 ppm before the Great Oxidation Event. Yet a recent study found fossil micrometeorites (MMs) containing the oxidized iron species wüstite (FeO) and magnetite (Fe3O4) formed 2.7 billion years ago (Ga). How these MMs became oxidized is uncertain. Abundant O2 in the upper atmosphere and iron oxidation by CO2 have been suggested. However, photochemical reactions cannot produce sufficient O2, and oxidation by CO2 can only produce FeO, each individually failing to explain the formation of Fe3O4-only MMs. Using an oxidation model of iron MMs including photochemistry, we show that a >32% CO2 Archean atmosphere and different entry angles can generate the Fe3O4-only and Fe-FeO mixed composition MMs that have been discovered. Oxidation happens in two stages: by CO2 under brief melting, then by O2. Our results challenge existing constraints on Earth’s atmospheric CO2 concentration at 2.7 Ga and support a warm Late Archean despite the ‘faint young Sun’.
…
by W. Essenbach, Jan 7, 2022 in WUWT
In my last post, entitled Advection, I was discussing the online MODTRAN Infrared Light In The Atmosphere model. A commenter pointed out that in the past I’d wondered about why the MODTRAN results showed that a doubling of CO2 caused a clear-sky top-of-atmosphere (TOA) decrease in upwelling longwave (LW) radiation of less than the canonical value of 3.7 watts per square meter (W/m2) per doubling of CO2. Here’s that data.
…
by UNIVERSITY OF YORK and the “blame Russia” department, February 26, 2018 in WUWT
Global levels of ethane and propane in the atmosphere have been underestimated by more than 50%, new research involving scientists at the University of York has revealed.
These hydrocarbons are particularly harmful in large cities where, through chemical reactions with emissions from cars, they form ozone – a greenhouse gas which is a key component of smog and directly linked to increases in mortality.
See also here and here
by Willis Eschenbach, July 13, 2017 in WUWT
Over at Dr. Curry’s excellent website, she’s discussing the Red and Blue Team approach. If I ran the zoo and could re-examine the climate question, I’d want to look at what I see as the central misunderstanding in the current theory of climate.
This is the mistaken idea that changes in global temperature are a linear function of changes in the top-of-atmosphere (TOA) radiation balance (usually called “forcing”).
by Hermann Harde, Global and Planetary Change, 24 February 2017
Highlights
-
An alternative carbon cycle is presented in agreement with the carbon 14 decay.
The CO2 uptake rate scales proportional to the CO2 concentration.
-
Temperature dependent natural emission and absorption rates are considered.
-
The average residence time of CO2 in the atmosphere is found to be 4 years.
-
Paleoclimatic CO2 variations and the actual CO2 growth rate are well-reproduced.
-
The anthropogenic fraction of CO2 in the atmosphere is only 4.3%.
-
Human emissions only contribute 15% to the CO2 increase over the Industrial Era.
Also this link
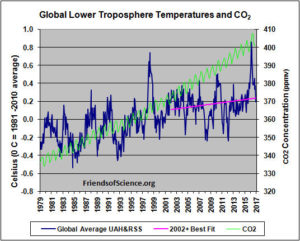
The December 2016 global temperature anomaly from the average of two analysis is 0.20 °C above the average of 1981 – 2010. The large El Niño event is over and we wait to see if it will be followed by a La Niña event. The satellite measured temperature of the lower troposphere to the end of 2016 from the average of the University of Alabama in Huntsville and Remote Sensing Systems analysis is here. The temperature trend from December 1997 to December 2016 is 0.045 ± 0.043 °C/decade at the 95% confidence interval. The slope could be as low as 0.002 °C/decade. According to the satellite data, 2016 was a statistically insignificant 0.02 °C warmer than 1998, which was another strong El Niño year.
- See also : Earth Cooling At The Fatest Rate On Record
- See also : Berkeley Earth -‘record temperature in 2016 appears to come from a strong El Nino’
- See also : 2016 Global Temperature, the Pause Never Went Away
- See also : What they don’t say about ‘the hottest ever year’ – 20 year warming trend is one third of what models predicted
- See also : Smoking Gun of Fraud by NASA and G. Schmidt
La géologie, une science plus que passionnante … et diverse
