Higher reactivity could explain temperature drop before last ice age
GFZ GeoForschungsZentrum Potsdam, Helmholtz Centre
From time to time, there have been long periods of cooling in Earth’s history. Temperatures had already fallen for more than ten million years before the last ice age began about 2.5 million years ago. At that time the northern hemisphere was covered with massive ice masses and glaciers. A geoscientific paradigm, widespread for over twenty years, explains this cooling with the formation of the large mountain ranges such as the Andes, the Himalayas and the Alps. As a result, more rock weathering has taken place, the paradigm suggests. This in turn removed more carbon dioxide (CO2) from the atmosphere, so that the ‘greenhouse effect’ decreased and the atmosphere cooled. This and other processes eventually led to the ‘ice Age’.
In a new study, Jeremy Caves-Rugenstein from ETH Zurich, Dan Ibarra from Stanford University and Friedhelm von Blanckenburg from the GFZ German Research Centre for Geosciences in Potsdam were able to show that this paradigm cannot be upheld. According to the paper, weathering was constant over the period under consideration. Instead, increased ‘reactivity’ of the land surface has led to a decrease in CO2 in the atmosphere, thus cooling the Earth. The researchers published the results in the journal Nature.
Geothermal heat flux can foment upper mantle temperature anomalies of 800–1000 °C, and these extreme heat intensities have been found to stretch across 500 km of central-east Greenland. This could result in “a significant contribution of ice melt to the ice-drainage system of Greenland” (Artemieva et al., 2019).
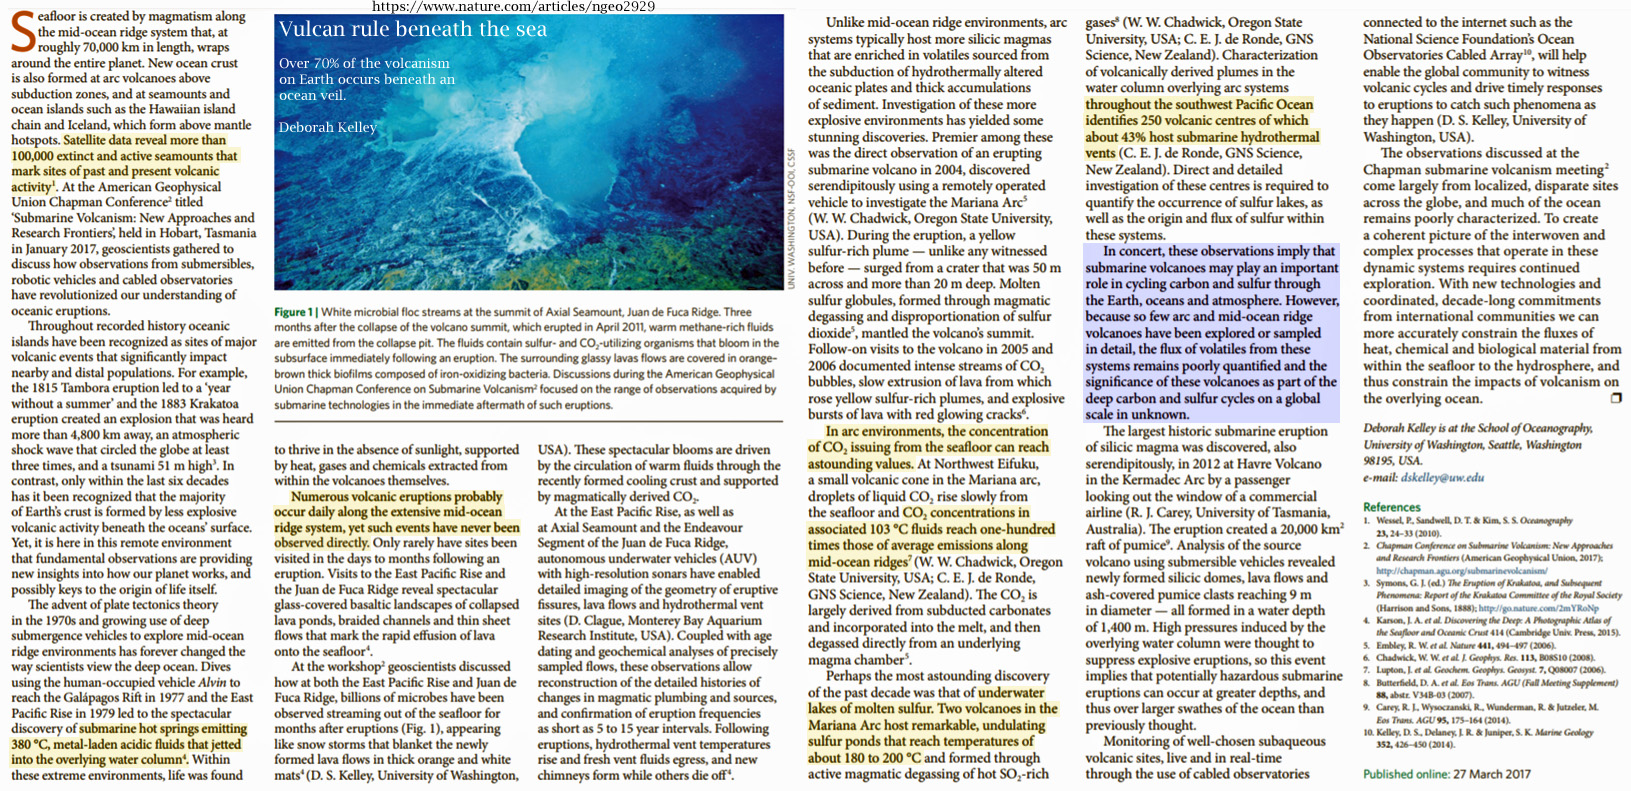
Evidence of more than 100,000 formerly or currently active volcanic vents permeate the Earth’s sea floor (Kelley, 2017).
Active volcanoes spew 380°C sulfuric acid and “metal-laden acidic fluids” into the bottom waters of the world ocean on a daily basis. In other words, literal ocean acidification is a natural phenomenon.
The carbon dioxide concentrations present in these acidic floods reach “astounding” levels, dwarfing the potential for us to even begin to appreciate the impact this explosive geothermal activity has on the Earth’s carbon cycle (Kelley, 2017).
THIS POST IS A CRITICAL EXAMINATION OF VARIOUS CLAIMS MADE BY CLIMATE SCIENCE ABOUT THE IMPACT OF CLIMATE CHANGE ON ANTARCTICA AND OF THE EVIDENCE FOR AGW CLAIMED TO BE FOUND IN DATA FROM ANTARCTICA.
IT IS BASED ON THE ANTARCTICA SECTION OF A LECTURE BY JAMES EDWARD KAMIS [LINK]
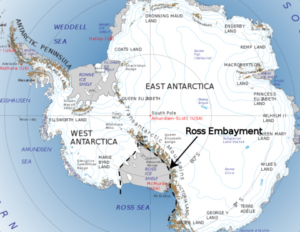
Antarctica is broken into two pieces. On the west is West Antarctica that constitutes 20% of Antarctica. The upper portion of West Antarctica forms a thumb. It’s called the Antarctic Peninsula. The remaining 80% of Antarctica is called East Antarctica. The right image shows a NASA graph that reflects ice melting on the entire continent from 1995 to 2015. It is here shown as a proxy for ice melting denominated as millimeters of sea level rise due to meltwater. Note that West Antarctica, inclusive of the Antarctic Peninsula, the 20% portion of the continent, accounts for all of the continent’s ice loss. East Antarctica, the much larger 80%, is actually gaining ice. This melt graph was created in 2015 by Dr. H. Jay Zwally is Chief Cryospheric Scientist at NASA’s Goddard Space Flight Center and Project Scientist for the Ice Cloud and Land Elevation Satellite.
The lopsided melt data raises this question: why is all the melt concentrated in 20% of the continent while the other 80% gains ice? The answer is found in the University of Washington 50-year average surface temperature map. It was generated in 2009 by Dr. Eric Steig – Earth and Space Sciences – University of Washington. It’s validity was hotly debated for many years. However, since that time, it has been proven correct by two more modern studies. NASA’s skin temperature map and British Antarctic Survey’s temperature map.
The surface temperature map that Dr. Steig made represents the temperature of the upper few meters of ice and sediment and does not reflect the temperature of the atmosphere…
by J.E. Kamis, May 25, 2016 in ClimateChangeDispatch
The most plausible scenario for southern Greenland’s surface ice melt is related to geologically induced heat flow and not atmospheric warming for various, well-established reasons. Based on research by the National Oceanic and Atmospheric Administration (NOAA) (see here), the top surface of southern Greenland’s ice sheet is currently melting at a high rate and therefore greatly reducing surface ice volume. They attribute this geographically localized melting effect to an unusually persistent and man-made atmospheric high pressure system (a so-called “Omega Block“) that has remained stationary above southern Greenland during the spring of 2016.
This non-moving high-pressure system has trapped a cell of very warm air above southern Greenland resulting in higher-than-normal surface ice melting rates and volumes. NOAA and the mainstream media are portraying this above-average melting as undeniable proof man-made global warming damaging our planet.
This portrayal is vastly misleading.
That’s because southern Greenland’s surface ice melt is more likely caused by natural, geologically induced heat flow from one of Earth’s largest Deep Ocean crustal plate junctures, the 10,000 mile long Mid-Atlantic Ridge (MAR). The Mid-Atlantic Ridge is “an immensely long mountain chain extending for about 10,000 miles (16,000 km) in a curving path from the Arctic Ocean to near the southern tip of Africa. The ridge is equidistant between the continents on either side of it. The mountains forming the ridge reach a width of 1,000 miles.”
The K-Pg extinction wiped out around 60% of the marine species around Antarctica, and 75% of species around the world. Victims of the extinction included the dinosaurs and the ammonites. It was caused by the impact of a 10 km asteroid on the Yucatán Peninsula, Mexico, and occurred during a time period when the Earth was experiencing environmental instability from a major volcanic episode. Rapid climate change, global darkness, and the collapse of food chains affected life all over the globe.
The K-Pg extinction fundamentally changed the evolutionary history of life on Earth. Most groups of animals that dominate modern ecosystems today, such as mammals, can trace the roots of their current success back to the aftermath of this extinction event.
A team of scientists from British Antarctic Survey, the University of New Mexico and the Geological Survey of Denmark & Greenland show that in Antarctica, for over 320,000 years after the extinction, only burrowing clams and snails dominated the Antarctic sea floor environment. It then took up to one million years for the number of species to recover to pre-extinction levels.
A team of scientists have given a fresh insight into what may have driven the “Cambrian Explosion” — a period of rapid expansion of different forms of animal life that occurred over 500 million years ago.
While a number of theories have been put forward to explain this landmark period, the most credible is that it was fuelled by a significant rise in oxygen levels which allowed a wide variety of animals to thrive.
The new study suggests that such a rise in oxygen levels was the result of extraordinary changes in global plate tectonics.
During the formation of the supercontinent ‘Gondwana’, there was a major increase in continental arc volcanism — chains of volcanoes often thousands of miles long formed where continental and oceanic tectonic plates collided. This in turn led to increased ‘degassing’ of CO2 from ancient, subducted sedimentary rocks.
This, the team calculated, led to an increase in atmospheric CO2and warming of the planet, which in turn amplified the weathering of continental rocks, which supplied the nutrient phosphorus to the ocean to drive photosynthesis and oxygen production.
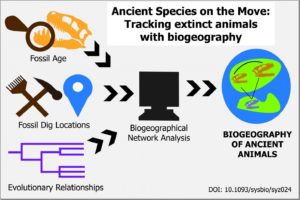
One researcher at the University of Tokyo is in hot pursuit of dinosaurs, tracking extinct species around ancient Earth. Identifying the movements of extinct species from millions of years ago can provide insights into ancient migration routes, interaction between species, and the movement of continents.
“If we find fossils on different continents from closely related species, then we can guess that at some point there must have been a connection between those continents,” said Tai Kubo, Ph.D., a postdoctoral researcher affiliated with the University Museum at the University of Tokyo.
A map of life – biogeography
Previous studies in biogeography — the geographic distribution of plants and animals — had not considered the evolutionary relationships between ancient species. The new method that Kubo designed, called biogeographical network analysis, converts evolutionary relationships into geographical relationships.
…
By combining data from fossils and models of the ancient Earth, researchers can map where ancient species may have migrated. This method, called biogeographical network analysis, converts evolutionary relationships between species into geographical relationships. This method was used in research by Tai Kubo, Ph.D., a postdoctoral researcher affiliated with the University Museum at the University of Tokyo. Credit Caitlin Devor, The University of Tokyo, CC-BY Usage Restrictions Image by Caitlin Devor, The University of Tokyo, CC-BY
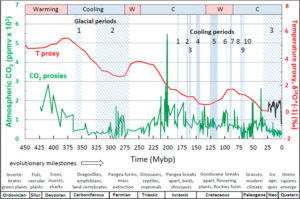
Assessing human impacts on climate and biodiversity requires an understanding of the relationship between the concentration of carbon dioxide (CO2) in the Earth’s atmosphere and global temperature (T). Here I explore this relationship empirically using comprehensive, recently-compiled databases of stable-isotope proxies from the Phanerozoic Eon (~540 to 0 years before the present) and through complementary modeling using the atmospheric absorption/transmittance code MODTRAN. Atmospheric CO2 concentration is correlated weakly but negatively with linearly-detrended T proxies over the last 425 million years.
Mercury found in ancient rock around the world supports theory that eruptions caused ‘Great Dying’ 252 million years ago.
Researchers say mercury buried in ancient rock provides the strongest evidence yet that volcanoes caused the biggest mass extinction in the history of the Earth.
The extinction 252 million years ago was so dramatic and widespread that scientists call it “the Great Dying.” The catastrophe killed off more than 95 percent of life on Earth over the course of hundreds of thousands of years.
Paleontologists with the University of Cincinnati and the China University of Geosciences said they found a spike in mercury in the geologic record at nearly a dozen sites around the world, which provides persuasive evidence that volcanic eruptions were to blame for this global cataclysm.
The study was published this month in the journal Nature Communications.
The eruptions ignited vast deposits of coal, releasing mercury vapor high into the atmosphere. Eventually, it rained down into the marine sediment around the planet, creating an elemental signature of a catastrophe that would herald the age of dinosaurs.
“Volcanic activities, including emissions of volcanic gases and combustion of organic matter, released abundant mercury to the surface of the Earth,” said lead author Jun Shen, an associate professor at the China University of Geosciences.
by P. Homewood, April 7, 2019 in NotaLotofPeopleKnowThat
ABSTRACT
It is thought that the Northern Hemisphere experienced only ephemeral glaciations from the Late Eocene to the Early Pliocene epochs (about 38 to 4 million years ago), and that the onset of extensive glaciations did not occur until about 3 million years ago. Several hypotheses have been proposed to explain this increase in Northern Hemisphere glaciation during the Late Pliocene. Here we use a fully coupled atmosphere-ocean general circulation model and an ice-sheet model to assess the impact of the proposed driving mechanisms for glaciation and the influence of orbital variations on the development of the Greenland ice sheet in particular. We find that Greenland glaciation is mainly controlled by a decrease in atmospheric carbon dioxide during the Late Pliocene. By contrast, our model results suggest that climatic shifts associated with the tectonically driven closure of the Panama seaway, with the termination of a permanent El Niño state or with tectonic uplift are not large enough to contribute significantly to the growth of the Greenland ice sheet; moreover, we find that none of these processes acted as a priming mechanism for glacial inception triggered by variations in the Earth’s orbit.
Over the last 540 million years, the Earth has weathered three major ice ages — periods during which global temperatures plummeted, producing extensive ice sheets and glaciers that have stretched beyond the polar caps.
Now scientists at MIT, the University of California at Santa Barbara, and the University of California at Berkeley have identified the likely trigger for these ice ages.
In a study published in Science, the team reports that each of the last three major ice ages were preceded by tropical “arc-continent collisions” — tectonic pileups that occurred near the Earth’s equator, in which oceanic plates rode up over continental plates, exposing tens of thousands of kilometers of oceanic rock to a tropical environment.
The scientists say that the heat and humidity of the tropics likely triggered a chemical reaction between the rocks and the atmosphere. Specifically, the rocks’ calcium and magnesium reacted with atmospheric carbon dioxide, pulling the gas out of the atmosphere and permanently sequestering it in the form of carbonates such as limestone.
Over time, the researchers say, this weathering process, occurring over millions of square kilometers, could pull enough carbon dioxide out of the atmosphere to cool temperatures globally and ultimately set off an ice age.
by James Kennett et al., March 13, 2019 in CO2Coalition
When UC Santa Barbara geology professor emeritus James Kennett and colleagues set out years ago to examine signs of a major cosmic impact that occurred toward the end of the Pleistocene epoch, little did they know just how far-reaching the projected climatic effect would be.
“It’s much more extreme than I ever thought when I started this work,” Kennett noted. “The more work that has been done, the more extreme it seems.”
He’s talking about the Younger Dryas Impact Hypothesis, which postulates that a fragmented comet slammed into the Earth close to 12,800 years ago, causing rapid climatic changes, megafaunal extinctions, sudden human population decrease and cultural shifts and widespread wildfires (biomass burning). The hypothesis suggests a possible triggering mechanism for the abrupt changes in climate at that time, in particular a rapid cooling in the Northern Hemisphere, called the Younger Dryas, amid a general global trend of natural warming and ice sheet melting evidenced by changes in the fossil and sediment record.
During the Mid-Holocene, when CO2 concentrations were stable and low (270 ppm), Antarctica’s massive Ross Ice Shelf naturally collapsed, adding the meltwater equivalent of 3-4 meters to sea levels.
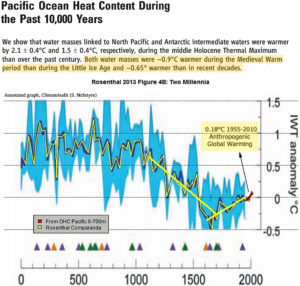
Because CO2 concentrations changed very modestly during the pre-industrial Holocene (approximately ~25 ppm in 10,000 years), climate models that are predicated on the assumption that CO2 concentration changes drive ocean temperatures, ice sheet melt, and sea level rise necessarily simulate a very stable Holocene climate.
In contrast, changes in ocean temperatures, ice sheet melt, and sea level rise rates were far more abrupt and variable during the Holocene than during the last 100 years.
Modern ocean changes are barely detectable in the context of natural variability
Note how the PETM (55 Ma) is about as far from a CO2 analog to modern times as it possibly could be… unless the PETM stomata data are correct, in which case AGW is even more insignificant than previously thought.
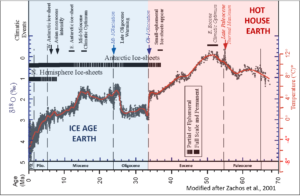
Regarding temperatures, the PETM is also about as far from being an analog to modern times as it possibly could be.
Figure 2. High latitude SST (°C) From benthic foram δ18O. Funny how the PETM is often cited as a nightmarish version of a real-world RCP8.5… While the warmer EECO is a climatic optimum. (Zachos et al., 2001). Note: Older is to the right.
“The Anthropocene as a geological epoch is not formally recognized”… So… “The term Anthropocene has” NOT “been widely used for the current period in Earth’s geological history“. It may be frequently used by activists and scientists who are ignorant of basic geology, but geologically speaking the term “Anthropocene” does not exist in any relationship to any period, epoch, age, era or eon in Earth’s geological history.
..
Yes, we have no Anthropocene, we have no Anthropocene today… Sung to the tune of Yes, We Have No Bananas.
Explaining the color of rocks is still a complex problem. This question was raised long ago in the community of geologists, particularly for the pigmentation of the ‘red marbles’ of the Frasnian of Belgium at the beginning of the last century, with many unsatisfactory hypotheses. Our recent analysis of different red carbonate rocks in Europe and North Africa (Morocco) may provide an alternative explanation for the color of these rocks. For this it was necessary to bring together diverse and complementary skills involving geologists, microbiologists and chemists. We present here a synthesis of these works. It is suggested that the red pigmentation of our studied Phanerozoic carbonate rocks, encompassing a time range from Pragian to Oxfordian, may be related to the activity of iron bacteria living in microaerophilic environments. A major conclusion is that this red color is only related to particular microenvironments and has no paleogeographic or climatic significance. All red carbonates have not necessarily acquired their pigmentation through the process established in this review. Each geological series must be analyzed in the light of a possible contribution of iron bacteria and Fungi.
Cet article est le résultat d’une recherche multi-disciplinaire entre géologues et biologistes. Une synthèse de cette recherche vient d’être publiée en décembre 2018 sur le site de Geologica Belgica. Un article déjà publié dans SCE peut également être consulté.
Contrairement à ce que l’on peut penser, une question simple nécessite parfois des années de recherches avec des équipes diverses et des moyens sophistiqués. La question simple concerne ici la géologie et plus particulièrement la couleur des roches sédimentaires.
Here, we reconstructed Phanerozoic PCO2 from a single proxy: the stable carbon isotopic fractionation associated with photosynthesis (Ɛp) that increases as PCO2 increases. This concept has been widely applied to alkenones, but here, we expand this concept both spatially and temporally by applying it to all marine phytoplankton via a diagenetic product of chlorophyll, phytane. We obtained data from 306 marine sediments and oils, which showed that Ɛp ranges from 11 to 24‰, agreeing with the observed range of maximum fractionation of Rubisco (i.e., 25 to 28‰). The observed secular PCO2 trend derived from phytane-based Ɛp mirrors the available compilations of PCO2over the past 420 Ma, except for two periods in which our higher estimates agree with the warm climate during those time periods. Our record currently provides the longest secular trend in PCO2 based on a single marine proxy, covering the past 500 Ma of Earth history
…
Fig. 2Ɛp calculated from phytane in Witkowski et al., 2018
A new study by The University of Texas at Austin has demonstrated a possible link between life on Earth and the movement of continents. The findings show that sediment, which is often composed of pieces of dead organisms, could play a key role in determining the speed of continental drift. In addition to challenging existing ideas about how plates interact, the findings are important because they describe potential feedback mechanisms between tectonic movement, climate and life on Earth.
The study, published Nov. 15 in Earth and Planetary Science Letters, describes how sediment moving under or subducting beneath tectonic plates could regulate the movement of the plates and may even play a role in the rapid rise of mountain ranges and growth of continental crust
The Paris Agreement adopted in December 2015 during the COP21 conference stipulates that the increase in the global average temperature is to be kept well below 2°C above “pre-industrial levels” and that efforts are pursued to limit the temperature increase to 1.5°C above “pre-industrial levels.” In order to further increase public acceptance of these limits it is important to transparently place the target levels and their baselines in a paleoclimatic context of the past 150,000 years (Last Interglacial, LIG) and in particular of the last 10,000 years (Holocene; Present Interglacial, PIG). Intense paleoclimatological research of the past decade has firmed up that pre-industrial temperatures have been highly variable which needs to be reflected in the pre-industrial climate baseline definitions …
Davis, W.J. 2017. The relationship between atmospheric carbon dioxide concentration and global temperature for the last 425 million years. Climate5: 76; doi: 10.3390/cli5040076.
Writing by way of introduction to his work, Davis (2017) notes that “a central question for contemporary climate policy is how much of the observed global warming is attributable to the accumulation of atmospheric CO2 and other trace greenhouse gases emitted by human activities.” If you talk to a climate alarmist, the answer you receive from such an inquiry will likely be “almost all.” A climate skeptic, on the other hand, will likely respond that the answer is “likely none.”
Hoping to provide some crucial information on this topic, Davis analyzed the relationship between historic temperature and atmospheric CO2 using the most comprehensive assemblage of empirical databases of these two variables available for the Phanerozoic period (522 to 0 million years before present; Mybp). In all, 6680 proxy temperature and 831 proxy CO2 measurements were utilized, enabling what Davis described as “the most accurate quantitative empirical evaluation to date of the relationship between atmospheric CO2concentration and temperature.” Multiple statistical procedures and analyses were applied to the proxy records and the resultant relationship is depicted in the figure below.
by P. Gosselin, September 23, 2018 in NoTricksZone
Last year, August, 2017, a massive rockslide occurred on the north flank of the Piz Cengalo (3369 m) in the Swiss Alps, above the village of Bondo, located near the border to Italy.
…
No data suggesting warming is behind rock slides
In total some 4 million tonnes of rock and mud came tumbling down. The dramatic incident highlighted the hazards posed by rock slides for villages located near the picturesque mountains of the European Alps.
Though rockslides are not unusual, there has been growing scrutiny behind their causes lately. Unsurprisingly climate alarmists are opportunistically pointing the finger at climate warming.
Alternate Title: Yes, We Have No Anthropocene, We Have No Anthropocene Today! (Sung to the tune of Yes, We Have No Bananas)
…
Figure 4 from Finney & Edwards. “Workflow for approval and ratification of a Global Standard Stratotype Section and Point (GSSP) proposal. Extensive discussion and evaluation occurs at the level of the working group, subcommission, and International Commission on Stratigraphy (ICS) Bureau. If approved at these successive levels, a proposal is forwarded to the International Union of Geological Sciences (IUGS) for ratification. This process is also followed for other ICS decisions on standardization, such as approval of names of formal units, of revisions to the units, and to revision or replacement of GSSPs.”
One final gem from Davis’ work is a pronouncement that follows a discussion on the lack of correlation between CO2 and temperature across the historical record, where he aptly reminds us that “correlation does not imply causality, but the absence of correlation proves conclusively the absence of causality.” Consequently, there should be no more doubt regarding the ineffectiveness of atmospheric CO2 to control or drive climate change. It is simply nothing more than a bit player, whose influence has been continually overestimated by climate alarmists. The big question now is whether or not 500 million years of these data will convince them otherwise!


