Archives par mot-clé : USA

‘Hidden’ NOAA temperature data reveals that 6 of the last 9 months were below normal in the USA – and NOAA can’t even get June right

by Anthony Watts, July 30 2019 in WUWT


A review of state-of-the-art climate data tells a different story than what NOAA tells the public.

While media outlets scream “hottest ever” for the world in June and July (it’s summer) and opportunistic climate crusaders use those headlines to push the idea of a “climate crisis” the reality is for USA is that so far most of 2019 has been below normal, temperature-wise.

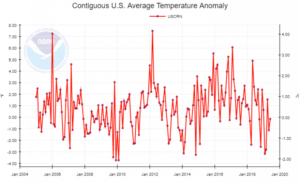
Little known data from the state of the art U.S. Climate Reference Network (which never seems to make it into NOAA’s monthly “state of the climate” reports) show that for the past nine months, six of them were below normal, shown in bold below.


201810 -0.18°F
201811 -2.56°F
201812 2.39°F
201901 0.63°F
201902 -3.15°F
201903 -2.81°F
201904 1.55°F
201905 -1.13°F
201906 -0.14°F

Above: Table 1, U.S. average temperature anomaly from October 2018 to June 2019. Full data file here

Note the below average value for June, 2019 at -0.14°F

Figure 1, U.S. average temperature anomaly from January 2005 to June 2019. Source of graph, NOAA, available here

ALL-TIME RECORD LOW TEMPERATURES SET ACROSS MONTANA + ONE TIED FROM 1898

by Cap Allon, July 23, 2019 in Electroverse


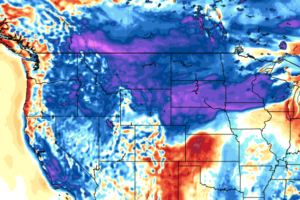
With the few days of ‘eastern heat’ taking all the headlines, the anomalous and long-lasting cold infecting vast swathes of North America is again being swept under the sustainably-sourced non-synthetic-petroleum-derived-fiber carpet. Record cold hit Montana over the weekend with several cities and towns setting new all-time record lows, but I’ll bet my diesel-guzzling L200 you never heard about it.

I’ve listed a few of the new record lows below:

  • Utica set a new record low of -1.1C (30F) on Saturday July 20.
  • Kalispell’s 2.2C (36F) busted the previous record of 3.3C (38F) set in 1996 (solar minimum of cycle 22).


You can view it from this link : https://electroverse.net/new-all-time-record-low-temperatures-set-across-montana/

Thirty years of unique data reveal what’s really killing coral reefs

by P. Homewood, July 24, 201 in NotatLotofPeopleKnowThat


Coral reefs are considered one of the most threatened ecosystems on the planet and are dying at alarming rates around the world. Scientists attribute coral bleaching and ultimately massive coral death to a number of environmental stressors, in particular, warming water temperatures due to climate change.

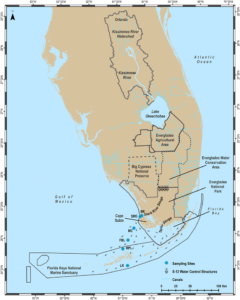
A study published in the international journal Marine Biology, reveals what’s really killing coral reefs. With 30 years of unique data from Looe Key Reef in the lower Florida Keys, researchers from Florida Atlantic University’s Harbor Branch Oceanographic Institute and collaborators have discovered that the problem of coral bleaching is not just due to a warming planet, but also a planet that is simultaneously being enriched with reactive nitrogen from multiple sources.

Improperly treated sewage, fertilizers and top soil are elevating nitrogen levels, which are causing phosphorus starvation in the corals, reducing their temperature threshold for “bleaching.” These coral reefs were dying off long before they were impacted by rising water temperatures. This study represents the longest record of reactive nutrients and algae concentrations for coral reefs anywhere in the world.

“Our results provide compelling evidence that nitrogen loading from the Florida Keys and greater Everglades ecosystem caused by humans, rather than warming temperatures, is the primary driver of coral reef degradation at Looe Key Sanctuary Preservation Area during our long-term study,” said Brian Lapointe, Ph.D., senior author and a research professor at FAU’s Harbor Branch.


https://phys.org/news/2019-07-years-unique-reveal-coral-reefs.html


There is the usual armwaving about climate change, but no evidence is presented as to why a small increase in CO2 levels should have the slightest effect on water temperatures or coral development, when the climate has been much warmer for most of the period since the end of the ice age.

As is usually the case with environmental degradation and species decline, it is the obvious factors which are responsible.

New York Heatwaves Like This Week’s Are The Norm

by P. Homewood, July 22, 2019 in NotaLotofPeopleKnowThat


Extremely hot weather has started to hit most of the United States, with temperatures set to peak over the weekend, meteorologists say.

The heatwave could affect about 200 million people in major cities like New York, Washington and Boston in the East Coast, and the Midwest region too.

In some places, temperatures could be close to or exceed 100F (38C). Parts of Canada are also being hit.

Experts link more frequent heatwaves in recent years to climate change.

The world experienced its hottest June on record this year, with an average temperature worldwide of 61.6F (16.4C), according to new data.

Earlier this month, the US state of Alaska, part of which lies inside the Arctic Circle, registered record high temperatures.

https://www.bbc.co.uk/news/world-us-canada-49049378


As I revealed last week, the Alaska claim was fake.

But what about this latest heatwave? Is it anything unusual?

Well not in New York, that’s for sure.

The temperature in Central Park never even got near 100F, peaking at 95F yesterday.


http://climod2.nrcc.cornell.edu/

What’s really killing the Coral Reefs?

by Carly Cassella, July 20, 2019 in WUWT


Coral reefs are one of the most threatened ecosystems on our planet, and in the past two decades alone, half of the coral in Florida has died off completely. Global warming is known to be a deadly factor, but rising ocean temperatures are only part of the story.

Thirty years of research in the Looe Key Sanctuary Preservation Area (LKSPA) on the southern tip of the Florida Keys has now revealed the cost of a devastating threat to coral that rivals even climate change: direct human pollution.

For years, agricultural run-off and improperly treated sewage have flowed into Florida’s ocean waters from the northern Everglades, elevating the sanctuary’s nitrogen levels and lowering the reef’s temperature threshold for bleaching, researchers say.

As a result of this deadly combination, coral cover in the region has declined from nearly 33 percent in 1984 to less than 6 percent in 2008.

In their analysis, the authors found that three mass bleaching events that occurred during these years only happened after heavy rainfall and increased land-based runoffs. In other words, if we can reduce the amount of local pollution that makes its way into our oceans, we might be able to reduce the worst of the damage.

Klein & Orlando, Bulletin of Marine Science, 1994

New Study Reveals True Cause Of Coral Bleaching (And It’s Not Global Warming)

by Brook Hays, July 16, 2019 in ClimateChangeDispatch


Corals are disappearing across the world’s oceans, and most scientists have pointed to warming water temperatures — the result of climate change — as the primary driver.

But new research suggests nitrogen pollution is the main cause of coral bleaching in Florida.

The study, published this week in the journal Marine Biology, was compiled using the three-decades worth of observational data collected at the Looe Key Reef in the lower Florida Keys.

“Our results provide compelling evidence that nitrogen loading from the Florida Keys and greater Everglades ecosystem caused by humans, rather than warming temperatures, is the primary driver of coral reef degradation at Looe Key Sanctuary Preservation Area,” lead study author Brian Lapointe, research professor at Florida Atlantic University’s Harbor Branch Oceanographic Institute, said in a news release.

Data collected at the test site showed nutrient runoff has boosted the nitrogen-phosphorus ratio in reef algae.

As more and more treated sewage and fertilizers from commercial farms rinse into local waterways and flood the oceans with nutrients, including reactive nitrogen, corals are unable to absorb sufficient levels of phosphorous.

“Our results provide compelling evidence that nitrogen loading from the Florida Keys and greater Everglades ecosystem caused by humans, rather than warming temperatures, is the primary driver of coral reef degradation at Looe Key Sanctuary Preservation Area,” lead study author Brian Lapointe, research professor at Florida Atlantic University’s Harbor Branch Oceanographic Institute, said in a news release.

Energy Dominance: US Crude Oil Production Tops 12 Million Barrels per Day in April!

by David Middleton, July 15, 2019 in WUWT


JULY 8, 2019
U.S. crude oil production surpassed 12 million barrels per day in April

U.S. crude oil production and lease condensate reached another milestone in April 2019, totaling 12.2 million barrels per day (b/d), according to EIA’s latest Petroleum Supply Monthly. April 2019 marks the first time that monthly U.S. crude oil production levels surpassed 12 million b/d, and this milestone comes less than a year after U.S. crude oil production surpassed 11 million b/d in August 2018.

Texas and the Federal Offshore Gulf of Mexico (GOM), the two largest crude oil production areas in the United States, both reached record levels of production in April at 4.97 million b/d and 1.98 million b/d, respectively. Oklahoma also reached a record production level of 617,000 b/d.

The U.S. onshore crude oil production increase is driven mainly by developing low permeability (tight) formations using horizontal drilling and hydraulic fracturing. EIA estimates that crude oil production from tight formations in April 2019 reached 7.4 million b/d, or 61% of the U.S. total.

More Failed Predictions: May Was The Second Wettest Month In US History

by Chriss Street, June 28, 2019 in ClimateChangeDispatch


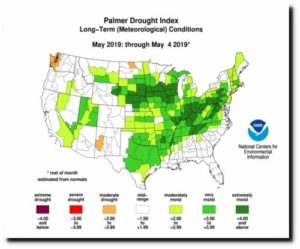
National Oceanic and Atmospheric Administration reported the month of May was the second wettest and temperatures were in the bottom-third for its 125-year US history.

The 2010 publication titled, ‘A Global Overview Of Drought and Heat-Induced Tree Mortality Reveals Emerging Climate Change Risks for Forests’, was accepted by the Obama administration as scientific evidence that climate change had made the Earth:

“…increasingly vulnerable to higher background tree mortality rates and die-off in response to future warming and drought, even in environments that are not normally considered water-limited.”

But NOAA just reported that May US precipitation totaled an average of 4.41 inches, 1.50 inches above average, and ranked second wettest in the 125-year period of record for May as well as second wettest for all months since January 1895.

The only wetter month in US history was May 2015 with 4.44 inches of precipitation.

The 37.68 inches of precipitation across the contiguous U.S. from June 2018 to May 2019 shattered the previous 1982-83 12-month period by 1.48 inches.

Near-record to record precipitation was observed from the West Coast through the central Plains and into the Great Lakes and parts of the Northeast.

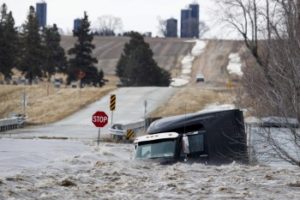
As a result, severe May flooding was observed along the Arkansas, Missouri, and Mississippi rivers. Vicksburg, MS, reported ongoing flooding since mid-February.

Weaning US power sector off fossil fuels would cost between $4.7tn and $10tn

by Reuters News Service, June 27, 2019 in CyprusMail


Eliminating fossil fuels from the U.S. power sector, a key goal of the “Green New Deal” backed by many Democratic presidential candidates, would cost $4.7 trillion and pose massive economic and social challenges, according to a report released on Thursday by energy research firm Wood Mackenzie.

That would amount to $35,000 per household, or nearly $2,000 a year for a 20-year plan, according to the study, which called the price tag for such a project “staggering.”

The report is one of the first independent cost estimates for what has become a key issue in the 2020 presidential election, with most Democrats proposing multi-trillion-dollar plans to eliminate U.S. carbon emissions economy-wide.

Front-runner Joe Biden’s plan to get to zero emissions, for example, carries a $1.7 trillion price tag, while Beto O’Rourke’s proposal comes in at $5 trillion. Representative Alexandria Ocasio-Cortez, one of the authors of the “Green New Deal,” a non-binding Congressional resolution, put the cost of a comprehensive climate solution at around $10 trillion.

Such ideas aim to tap into a growing sense of urgency about global warming on both sides of the political divide, but have been panned by President Donald Trump and many Republicans as being unfeasible, costly, and a threat to the economy.

A power-generating wind turbine is seen in Saint-Laurent-Des-Eaux near Orleans, France

Without Mining, There Is No ‘Green Revolution’

by S. Moore A. & Bridges, June17, 2019 in ClimateChangeDispatch


The recent threats by Beijing to cut off American access to critical mineral imports has many Americans wondering why our politicians have allowed the United States to become so overly-dependent on China for these valued resources in the first place.

Today, the United States is 90 percent dependent on China and Russia for many vital “rare earth minerals.”

The main reason for our over-reliance on nations like China for these minerals is not that we are running out of these resources here at home. The U.S. Mining Association estimates that we have at least $5 trillion of recoverable mineral resources.

The U.S. Geological Survey reports that we still have up to 86 percent or more of key mineral resources like copper and zinc remaining in the ground, waiting to be mined.

These resources aren’t on environmentally sensitive lands, like national parks, but on the millions of acres of federal, state and private lands.

The mining isn’t happening because of extremely prohibitive environmental rules and a permitting process that can take 5-10 years to open a new mine. Green groups simply resist almost all new drilling.

What they may not realize is that the de facto mining prohibitions jeopardize the “Green Energy Revolution” that liberals so desperately are seeking.

How is this for rich irony: To make renewable energy at all technologically plausible, will require massive increases in the supply of rare earth and critical minerals.

ENERGY SUPERPOWER USA: SHALE OIL & GAS HIT RECORD PRODUCTION LEVELS IN 2018

by GWPF, June 12, 2019 in TheWallStreetJournal


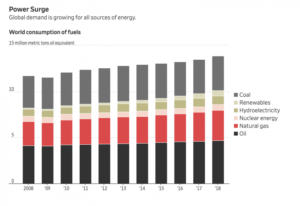
World-wide energy demand grew at its fastest rate since 2010

The shale revolution powered U.S. oil and gas production in 2018 to the largest annual increases ever recorded by any country, according to energy giant BP PLC .

Surging global energy demand is fueling the production boom, even as oil and gas prices rise and economic growth slows, said BP’s annual statistical review published Tuesday.

World-wide demand for energy grew 2.9% in 2018, its fastest rate since 2010.

Unusual weather spurred some of the stronger-than-expected growth, as a greater number of extremely hot and cold days drove up air conditioning and heating use around the world, particularly in China, the U.S. and Russia, the company said.

In the U.S., energy consumption rose by 3.5% in 2018, with oil at 20.5 million barrels a day and a total of 817 billion cubic meters of gas consumed during the year.


EIA data shows wind & solar met 3% of U.S. energy after $50 billion in subsidizes

by Larry Hamlin, June 6, 2019 in WUWT


The EIA AEO 2019 report shows that in year 2018 wind and solar energy resources provide about 3% of U.S. total energy consumption while fossil fuel energy resources provide about 81% of total energy use.

The dominate use of fossil fuels in meeting U.S. energy needs remains little changed from a decade ago before use of renewable energy resources became mandated and supported by lucrative government subsidizes.

Using additional EIA data the total wind and solar provided energy going back to year 2000 is available which allows an assessment of the Production Tax Credit (PTC) payments to be made.

Glacier National Park Quietly Removes Its ‘Gone by 2020’ Signs

by Roger I. Roots, May 30, 2019 in WUWT


Founder, Lysander Spooner University

May 30, 2019. St. Mary, Montana. Officials at Glacier National Park (GNP) have begun quietly removing and altering signs and government literature which told visitors that the Park’s glaciers were all expected to disappear by either 2020 or 2030.
In recent years the National Park Service prominently featured brochures, signs and films which boldly proclaimed that all glaciers at GNP were melting away rapidly. But now officials at GNP seem to be scrambling to hide or replace their previous hysterical claims while avoiding any notice to the public that the claims were inaccurate. Teams from Lysander Spooner University visiting the Park each September have noted that GNP’s most famous glaciers such as the Grinnell Glacier and the Jackson Glacier appear to have been growing—not shrinking—since about 2010. (The Jackson Glacier—easily seen from the Going-To-The-Sun Highway—may have grown as much as 25% or more over the past decade.)

Montana Glacier National Park Mountains Cracker Lake

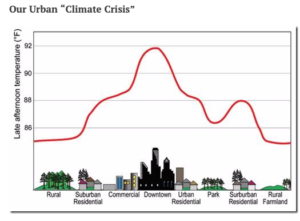
Our Urban “Climate Crisis”

by Jim Steele, May 17, 2019 in WUWT


Based on a globally averaged statistic, some scientists and several politicians claim we are facing a climate crisis. Although it’s wise to think globally, organisms are never affected by global averages. Never! Organisms only respond to local conditions. Always! Given that weather stations around the globe only record local conditions, it is important to understand over one third of the earth’s weather stations report a cooling trend (i.e. Fig 4 below ) Cooling trends have various local and regional causes, but clearly, areas with cooling trends are not facing a “warming climate crisis”. Unfortunately, by averaging cooling and warming trends, the local factors affecting varied trends have been obscured.

It is well known as human populations grow, landscapes lose increasing amounts of natural vegetation, experience a loss of soil moisture and are increasingly covered by heat absorbing pavement and structures. All those factors raise temperatures so that a city’s downtown area can be 10°F higher than nearby rural areas. Despite urban areas representing less than 3% of the USA’s land surface, 82% of our weather stations are located in urbanized areas. This prompts critical thinkers to ask, “have warmer urbanized landscapes biased the globally averaged temperature?” (Arctic warming also biases the global average, but that dynamic must await a future article.)

Vice-President Šefčovič joins U.S. President Trump in opening an LNG export terminal

by European Commission, May 14, 2019


LNG

Los Angeles targets eradication of petrol cars by 2050

by Nathalie Sauer,   April 30, 2019 in ClimateHomeNews


Mayor unveils plan aiming for 100% zero-emissions vehicles by 2050 amid sweeping climate package for the city

Los Angeles’ car-choked arteries will run clean within decades, according to a green reform package unveiled by mayor Eric Garcetti on Monday.

Speaking only a week after New York City mayor Bill de Blasio announced his own framework climate legislation, Garcetti presented plans to revolutionise local car culture and green the city’s buildings, which together account for three-quarters of LA’s emissions.

“Los Angeles needs to lead, but the whole world needs to act. This plan gives us a fighting chance,” Garcetti told the Los Angeles Times. “It’s sort of a ‘greenprint’ for every other city in the country and the world, hopefully.”

The legislation, which builds upon a previous 2015 sustainability plan, calls on the city to hike its percentage of zero emission vehicles from 1.4% in 2018 to 25% by 2025, 80% by 2035 and 100% by 2050. To do this, the City Town Hall intends to raise its number of publicly available electric-vehicle chargers from 2,100 to 28,000.

BIG NEWS – Verified by NOAA – poor weather station siting leads to artificial long term warming

by Anthony Watts, May 3, 2019 in WUWT


I’ve been saying for years that surface temperature measurements (and long term trends) have been affected by encroachment of urbanization on the placement of weather stations used to measure surface air temperature, and track long term climate. In doing so we found some hilariously bad examples of climate science in action, such as the official USHCN climate monitoring station at the University of Arizona, Tucson:


USHCN weather station in a parking lot. University of Arizona, Tucson

I have published on the topic in the scientific literature, and found this to be true based on the science we’ve done of examining the USHCN and applying the siting methodology of Leroy 2010.

In Fall et al, 2011 we discovered that there was a change to the diurnal temperature range (DTR). It decreased where stations had been encroached upon, because of the heat sink effect of man-made materials (asphalt, concrete, bricks, etc.) that were near stations.

Impacts of Small-Scale Urban Encroachment on Air Temperature Observations

by R.D. Leeper et al., 2019 in J.Appl.Met.Climatology


A field experiment was performed in Oak Ridge, TN, with four instrumented towers placed over grass at increasing distances (4, 30, 50, 124, and 300 m) from a built-up area. Stations were aligned in such a way to simulate the impact of small-scale encroachment on temperature observations. As expected, temperature observations were warmest for the site closest to the built environment with an average temperature difference of 0.31 and 0.24 °C for aspirated and unaspirated sensors respectively. Mean aspirated temperature differences were greater during the evening (0.47 °C) than day (0.16 °C). This was particularly true for evenings following greater daytime solar insolation (20+ MJDay−1) with surface winds from the direction of the built environment where mean differences exceeded 0.80 °C. The impact of the built environment on air temperature diminished with distance with a warm bias only detectable out to tower-B’ located 50 meters away.

The experimental findings were comparable to a known case of urban encroachment at a U. S. Climate Reference Network station in Kingston, RI. The experimental and operational results both lead to reductions in the diurnal temperature range of ~0.39 °C for fan aspirated sensors. Interestingly, the unaspirated sensor had a larger reduction in DTR of 0.48 °C. These results suggest that small-scale urban encroachment within 50 meters of a station can have important impacts on daily temperature extrema (maximum and minimum) with the magnitude of these differences dependent upon prevailing environmental conditions and sensing technology.

Analysis of new NASA AIRS study: 80% of U.S. Warming has been at Night

by Dr. Roy Spencer, April 30, 2019 in WUWT


I have previously addressed the NASA study that concluded the AIRS satellite temperatures “verified global warming trends“. The AIRS is an infrared temperature sounding instrument on the NASA Aqua satellite, providing data since late 2002 (over 16 years). All results in that study, and presented here, are based upon infrared measurements alone, with no microwave temperature sounder data being used in these products.

That reported study addressed only the surface “skin” temperature measurements, but the AIRS is also used to retrieve temperature profiles throughout the troposphere and stratosphere — that’s 99.9% of the total mass of the atmosphere.

Since AIRS data are also used to retrieve a 2 meter temperature (the traditional surface air temperature measurement height), I was curious why that wasn’t used instead of the surface skin temperature. Also, AIRS allows me to compare to our UAH tropospheric deep-layer temperature products.

So, I downloaded the entire archive of monthly average AIRS temperature retrievals on a 1 deg. lat/lon grid (85 GB of data). I’ve been analyzing those data over various regions (global, tropical, land, ocean). While there are a lot of interesting results I could show, today I’m going to focus just on the United States.

Legislation Would End Oil and Gas Production In Most of California

by Katy Grimes, April 22, 2019 in CaliforniaGlobe


The “Keep it In the Ground,” anti-oil and gas industry movement is going after the industry with more legislation disguised to address health and local control issues, despite that California already has the most environmentally regulated oil and gas production in the world, regulated by more than 25 agencies.

“Keep It in the Ground” is a global protest movement opposing fossil fuel development.

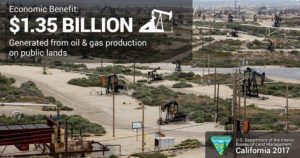
California was the fourth-largest producer of crude oil among the 50 states in 2017, after Texas, North Dakota, and Alaska, and, as of January 2018, third in oil refining capacity after Texas and Louisiana.

AB 345 by Assemblyman Al Muratsuchi (D-Torrance), would increase setback distance between oil production facilities and private and public property to 2,500 feet for every well, existing or planned in the state.

According to the Western States Petroleum Association and the California Independent Petroleum Association, this bill, if passed, would effectively end oil production in many parts of the state and threaten the future of production IN ALL PARTS OF THE STATE, for example:

  • 87% of all wells in the City of Los Angeles would be shut in

  • 66% of the well in Los Angeles County would be shut in

  • Thousands of wells in Kern County will be shut in

Another climate lie bites the dust – No, Honolulu’s beaches aren’t going to disappear in 20 years

by Aylin Woodward, April 25, 201 in WUWT


In May 2017, high tides engulfed parts of the iconic Waikiki beach, edging dangerously close to waterfront hotels. This kind of high-tide flooding, often called a king tide or sunny-day flood, occurs when ocean water surges to higher levels than coastal infrastructure was designed to accommodate. In that case, water levels rose 2.5 feet above average in Waikiki, drowning nearby roads and sidewalks.

According to a 2017 report (which was updated in September 2018), Hawaii’s state capital and Waikiki Beach – along with other coastal strips on Hawaii’s five islands – are expected to experience frequent flooding within 15 to 20 years.

“This flooding will threaten $5 billion of taxable real estate; flood nearly 30 miles of roadway; and impact pedestrians, commercial and recreation activities, tourism, transportation, and infrastructure,” Shellie Habel, lead author of the 2017 study, said in a release.

Now, Hawaii state lawmakers are taking steps to shore up the state’s beaches and coastal cities. A new bill that mandates a statewide shore protection program has passed both houses of Hawaii’s state legislature, and will soon makes its way to the governor’s desk for approval.


All well and good that they want to improve beach resilience. But, the claim that ” Hawaii’s iconic Waikiki Beach could be engulfed by the ocean in 20 years ” is totally bogus.

Here is why:


Abiotic Oil: Real(ish)Things That Don’t Matter, Part Deux

by David Middleton, April 16, 2019 in WUWT


In part one of this series, we looked at Peak Oil and its irrelevance to energy production. In Part Deux, we will look at “abiotic oil,” a real(ish) thing that really doesn’t matter outside of academic discussions and SyFy blogs.

A note on terminology

Some refer to this as “abiogenic oil.” This is not a useful term because all oil is abiogenic. The generally accepted theory of petroleum formation doesn’t state that it is a biogenic process. I discussed this in detail in a 2017 post. I don’t intend to restate it here.

In this post, “abiotic oil” refers to petroleum formed by processes that do not rely on biological source material. The carbon in “abiotic oil” must be inorganic.

A real example of abiotic “oil”

The Lost City Hydrothermal Field is located on the Mid-Atlantic Ridge, about 15 km (~9 mi) west of the spreading center, in water depths ranging from 750-900 m (~2,500-3,000′) (Kelley et al., 2005).

Figure 1. Lost City location map. (University of Washington)

Isle de Jean Charles & Sea Level Rise

by P. Homewood, April 20, 2019 in NotaLotOfPeopleKKnowThat


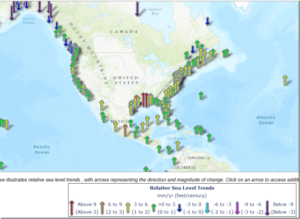
The Isle de Jean Charles, Louisiana. It’s been largely submerged beneath the sea over the last 6 decades. The program gives the definite impression that the main reason for this inundation is sea level rise due to melting ice and thermal expansion of the oceans – driven by man-made climate change. Attenborough does mention oil extraction as a cause but his narrative is lost to the general tone of the messaging that this is a “climate catastrophe” and that the families driven from their homes in this part of Louisiana are some of the world’s first “climate refugees”. This is palpable bullshit.


https://tidesandcurrents.noaa.gov/sltrends/sltrends.html