by P. Homewood, April 20, 2019 in NotaLotOfPeopleKKnowThat
The Isle de Jean Charles, Louisiana. It’s been largely submerged beneath the sea over the last 6 decades. The program gives the definite impression that the main reason for this inundation is sea level rise due to melting ice and thermal expansion of the oceans – driven by man-made climate change. Attenborough does mention oil extraction as a cause but his narrative is lost to the general tone of the messaging that this is a “climate catastrophe” and that the families driven from their homes in this part of Louisiana are some of the world’s first “climate refugees”. This is palpable bullshit.
Although many meteorologists and climatologists confirm that there is no data suggesting global warming is causing more frequent and intense tornado and hurricane activity, there is a small but influential alarmist group who claim otherwise. And it’s no surprise who the click-baiting media parrot at maximum volume.
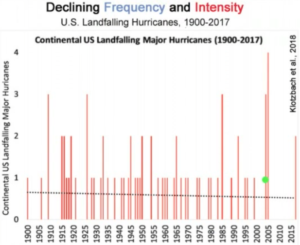
Landfalling hurricanes downward trend
At the 5:45 mark, Joe presents a chart depicting the frequency of US landfalling hurricanes since 1900:
When heavy rain falls over the Indian Ocean and Southeast Asia and the eastern Pacific Ocean, it is a good indicator that temperatures in central California will reach 100°F in four to 16 days, according to a collaborative research team from the University of California, Davis, and the Asia-Pacific Economic Cooperation (APEC) Climate Center in Busan, South Korea.
The results were published in Advances in Atmospheric Scienceson April 12.
FROM PREDICTION TO PROTECTION
Heat waves are common in the Central California Valley, a 50-mile-wide oval of land that runs 450 miles from just north of Los Angeles up to Redding. The valley is home to half of the nation’s tree fruit and nut crops, as well as extensive dairy production, and heat waves can wreak havoc on agricultural production. The dairy industry had a heat wave-induced economic loss of about $1 billion in 2006, for instance. The ability to predict heat waves and understand what causes them could inform protective measures against damage.
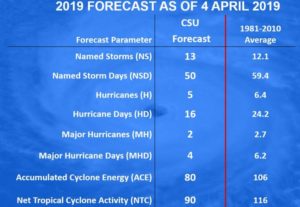
Dr. Philip Klotzbach of Colorado State University writes on Twitter:
Seasonal #hurricane forecast from @ColoradoStateU predicts slightly below-average season: 13 named storms, 5 hurricanes & 2 major (Cat 3+, >=111 mph) hurricanes. Primary reason for slightly below-avg forecast is anticipated continuation of weak #ElNino.
We anticipate that the 2019 Atlantic basin hurricane season will have slightly belownormal activity. The current weak El Niño event appears likely to persist and perhaps even strengthen this summer/fall. Sea surface temperatures averaged across the tropical Atlantic are slightly below normal, and the far North Atlantic is anomalously cool.
Our Atlantic Multi-decadal Oscillation index is below its long-term average. We anticipate a slightly below-average probability for major hurricanes making landfall along the continental United States coastline and in the Caribbean. As is the case with all hurricane seasons, coastal residents are reminded that it only takes one hurricane making landfall to make it an active season for them. They should prepare the same for every season, regardless of how much activity is predicted.
PROBABILITIES FOR AT LEAST ONE MAJOR (CATEGORY 3-4-5) HURRICANE LANDFALL ON EACH OF THE FOLLOWING COASTAL AREAS:
1) Entire continental U.S. coastline – 48% (average for last century is 52%)
2) U.S. East Coast Including Peninsula Florida – 28% (average for last century is 31%)
3) Gulf Coast from the Florida Panhandle westward to Brownsville – 28% (average for last century is 30%)
PROBABILITY FOR AT LEAST ONE MAJOR (CATEGORY 3-4-5) HURRICANE TRACKING INTO THE CARIBBEAN
(10-20°N, 88-60°W) 1) 39% (average for last century is 42%)
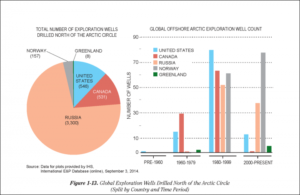
I ran across a very lucid and informative article on Real Clear Energy today. The author is Robert Dillon, “a senior adviser on energy security at the American Council for Capital Formation and the former communications director of the Senate Energy and Natural Resources Committee.” The article includes numerous links to supporting information, particularly the National Petroleum Council’s (NPC) 2015 report on U.S. Arctic oil & gas resource potential.
Arctic oil and gas resources are large and can contribute significantly to meeting future U.S. and global energy needs.
The arctic environment poses some different challenges relative to other oil and gas production areas, but is generally well understood.
The oil and gas industry has a long history of successful operations in arctic conditions enabled by continuing technology and operational advances.
Most of the U.S. Arctic offshore conventional oil and gas potential can be developed using existing field-proven technology.
The economic viability of U.S. Arctic development is challenged by operating conditions and the need for updated regulations that reflect arctic conditions.
Realizing the promise of Arctic oil and gas requires securing public confidence.
There have been substantial recent technology and regulatory advancements to reduce the potential for and consequences of a spill.
Figure 1-1. Arctic exploration wells by country and time period. (NPC)
While U.S. coal consumption has generally declined since its 2008 peak, EIA expects that U.S. coal exports reached 116 million short tons (MMst) in 2018, the highest level in five years, based on foreign trade data collected by the U.S. Census Bureau. Exports of coal from the United States have increased since 2016 as international prices have made it more economic for U.S. producers to sell coal overseas.
In 2018, the United States exported 15% of its coal, and the remaining 85% was sold to end-use markets, primarily power sector and industrial customers. Coal exports have increased during the past two years, driven by increasing international coal demand, and in 2018 accounted for the largest share of total U.S. coal disposition on record. The United States exported 54 MMst of steam coal and 62 MMst of metallurgical coal in 2018, based on export data collected by the U.S. Census Bureau.
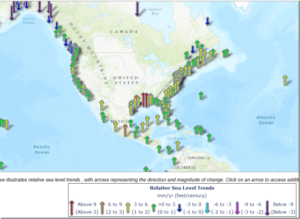
NOAA tide gauge data measurements exist for 17 locations along the California coast with 8 of these locations having actual measured sea level rise data covering periods for more than 70 to 120 years in duration.
This measured data shows that none of these California locations are experiencing coastal sea level rise acceleration since climate alarmist first made such erroneous and flawed sea level acceleration claims before the U.S. Senate in 1988.
Climate alarmists and their supporting media conveniently conceal the fact that their flawed claims have been hyped for the last 30 years as they continue to try again and again to make the same repeated but flawed claims apparently hoping that the public will forget their long track record of failure and exaggeration.
NOAA measured tide gauge data shows that coastal sea level rise at Ca. locations varies between 3 to 12 inches per century and have remained at those levels during the long measurement periods during which actual measured data have been recorded with a sample of that measured data shown below for San Diego, La Jolla, Los Angeles and San Francisco.
New York (CNN Business)Move over, Saudi Arabia. America is about to steal the kingdom’s energy exporting crown.
The United States will surpass Saudi Arabia later this year in exports of oil, natural gas liquids and petroleum products, like gasoline, according to energy research firm Rystad Energy.
That milestone, driven by the transformative shale boom, would make the United States the world’s leading exporter of oil and liquids. That has never happened since Saudi Arabia began selling oil overseas in the 1950s, Rystad said in a report Thursday.
“It’s nothing short of remarkable,” said Ryan Fitzmaurice, energy strategist at Rabobank. “Ten years ago, no one thought it could happen.”
The expected breakthrough reflects how technology has reshaped the global energy landscape. Drilling innovations have opened up huge swaths of oil and natural gas resources that had been trapped in shale oilfields in Texas, North Dakota and elsewhere.
Led by shale, US oil production has more than doubled over the past decade to all-time highs. The United States now pumps more oil than any other country, including Russia and Saudi Arabia.
“The shale boom has driven incredible increases in production,” said Fitzmaurice. “US production is off the charts.”
And the U.S. is not alone in trying to maximize oil and gas production. Despite the financial failures of the U.S. fracking industry, international efforts to duplicate the American fracking story are ramping up across the globe.
The CEO of Saudi Arabian state oil company Aramco recently dismissed the idea that global demand for oil will decrease anytime soon and urged the oil industry to “push back on exaggerated theories like peak oil demand.”
Khalid al Falih, Saudi Arabia’s energy minister, told the Financial Times, “Going forward the world is going to be Saudi Aramco’s playground.” But not if other countries frack there first.
China Expanding Fracking Efforts, Testing New Technology
The Las Vegas Valley Snow Event: What happened? Did we see this coming? Yes and no. We had been seeing very small chances for snow in the valley for a few days, but it wasn’t until Sunday afternoon that the hi-resolution models were consistently indicating that western parts of the valley could see up to 3 inches and up to an inch elsewhere. That’s when the decision was made to issue the Winter Weather Advisory.
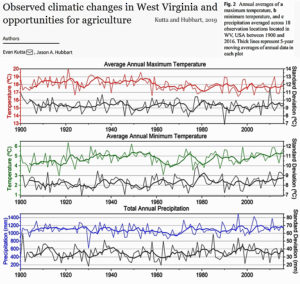
“Between 1900 and 2016, climatic trends were characterized by significant reductions in the maximum temperatures (−0.78°C/century; p = 0.001), significant increases in minimum temperatures (0.44 °C/century; p = 0.017) [overall -0.34°C/century], and increased annual precipitation (25.4 mm/century) indicative of a wetter and more temperate WV climate. Despite increasing trends of growing degree days during the first (p ≤ 0.015) and second half of the period of record, the long-term trend indicated a decrease in GDD [warm growing degree days] of approximately 100 °C/days.”
There has been almost a death watch going on for Chicago, looking for an all time new all-time low temperature record to beat the previous -27°F. For those wishing for a new datapoint, Chicago didn’t beat the all time record, but did set a new record for the day…
A “Siberian Express” weather disturbance currently crossing the Arctic Ocean will meet up with the semi-permanent winter “polar vortex” over Canada, pushing a record-breaking cold air mass into the Upper Plains and Midwest U.S. by Wednesday.
Chicago All-Time Record Low?
Both the European (ECMWF) and U.S. (GFS) weather forecast models are in agreement that by Wednesday morning temperatures in the Chicago suburbs will be approaching -30 deg. F. The all-time official record low for the Chicago metro area was -27 deg. F (O’Hare) on January 20, 1985, and that 34 year old record could fall as the ECMWF model is forecasting -32 deg. F for Thursday morning while the GFS model is bottoming out at -26 deg. F on Wednesday morning. Of course, these forecasts will change somewhat in the coming days as the cold wave approaches.
Après trois années de baisse, les émissions américaines de CO2 liées à l’énergie auraient augmenté de 3,4% en 2018 selon les dernières estimations du cabinet Rhodium Group. Explications.
Une hausse des émissions malgré la baisse de consommation de charbon
Les émissions américaines de CO2 liées à l’énergie auraient connu en 2018 (+ 3,4%) leur deuxième plus forte hausse annuelle des deux dernières décennies, après 2010 (+ 3,8% dans un contexte de reprise économique après la crise de 2008) selon les dernières estimations de Rhodium Group publiées le 8 janvier.
La consommation de charbon a pourtant significativement baissé aux États-Unis en 2018 selon l’EIA. Dans le secteur électrique, le « King Coal » s’efface peu à peu au profit du gaz naturel, plus compétitif (avec l’exploitation du gaz de schiste) : la part du charbon dans la production nationale d’électricité aurait atteint 28% en 2018 (et pourrait encore diminuer à 26% en 2019), contre 35% pour le gaz naturel selon le Short-Term Energy Outlook de l’EIA publié en décembre dernier.
A growing number of climate advocates say increasing the price of fossil fuels is the surest way to reduce greenhouse gas emissions, but leaders in the House and Senate are resisting calls for a carbon tax in Vermont.
During the last two legislative sessions, lawmakers introduced several bills that would have assessed a new tax on carbon-emitting fossil fuels. Last week, on the opening day of the legislative session, 40 or so people rallied in the Statehouse cafeteria against a carbon tax.
Du gaz et du pétrole de schiste sont découverts à profusion dans le monde, notamment aux États-Unis. Qui en parle dans nos grands media ? Serait-ce politiquement incorrect de l’évoquer ?
LE SUCCÈS DU PARI DU GAZ ET DU PÉTROLE DE SCHISTE
Le Texas aux États-Unis regorge de pétrole et de gaz de schiste au point que les gazoducs existants sont saturés ! Le gaz doit même être « torché » ou « éventé ».
En attendant la mise en service de nouvelles capacités de transport, la production doit être réduite faute de pouvoir exporter les quantités extraites. La production de pétrole de schiste doit aussi être réduite en parallèle car il est extrait avec le gaz (et vice-versa).
Des projets sont en développement pour évacuer le gaz vers le Golfe du Mexique pour le liquéfier (GPL) et pouvoir ainsi l’exporter par bateau méthanier.
PREMIER PRODUCTEUR DE PÉTROLE
Les États-Unis ont dépassé la Russie et l’Arabie Saoudite pour devenir le premier producteur de pétrole brut en 2018 a annoncé l’agence américaine de l’énergie (EIA).
Après avoir stagné autour de 6 millions de barils par jour (Mb/j) en moyenne de 1933 à 2013, la production a grimpé à 9,4 Mb/j en 2017, puis à 10,4 Mb/j en 2018, et elle passera à 11,5 Mb/j 2019.
La surabondance de gaz de schiste associé à l’extraction du pétrole de schiste a fait chuter les prix au terminal gazier à l’ouest du Texas jusqu’à 1 dollar par million d’unité thermique britannique (dollar/MM-Btu), alors qu’il vaut 13 à 14 dollars/MM-Btu sur le marché européen.
A booming economy. GDP growth during the first 2 years of the Trump administration has been about 50% higher than that of Obama’s eight-year maladministration.
Our manufacturing sector is booming.
A cold winter.
A booming economy drove up trucking and air travel.
Electricity demand increased and most of the increasing was powered by natural gas because renewables couldn’t even keep up with no growth.
The Appalachian Basin is driving growth of record-shattering U.S. natural gas production, which in turn has helped spur more than $25 billion in natural gas electricity generation investment in the region. In fact, there are 29 new 475-megawatt (MW) or greater natural gas-fired power plants that are in various stages of permitting, under construction or have recently become operational in Ohio (10), Pennsylvania (16) and West Virginia (3), representing more than 26,000 MW of added electric capacity, more than 17,000 jobs during construction and incredible emissions reductions in the electricity sector.
Things often calm down after January 1 during El Nino years….but not this year…with the U.S. West Coast from central California to Washington State about to be pummeled by a series of storms. Rain, snow, wind? Plenty for everyone.
A view of the latest infrared satellite imagery shows an amazing line-up of one storm after another stretching way into the Pacific. A traffic jam of storms.
Let’s examine our stormy future, using a series of sea level pressure forecasts from the UW WRF weather forecast models (solid lines are sea level pressure, shading in lower atmosphere temperature).
In the whirlwind that is 2018, there has been a notable lack of high-end twisters.
We’re now days away from this becoming the first year in the modern record with no violent tornadoes touching down in the United States. Violent tornadoes are the strongest on a 0 to 5 scale, or those ranked EF4 or EF5.
It was a quiet year for tornadoes overall, with below normal numbers most months. Unless you’re a storm chaser, this is not bad news. The low tornado count is undoubtedly a big part of the reason the 10 tornado deaths in 2018 is also vying to be a record low.
While we still have several days to go in 2018, and some severe weather is likely across the South to close it out, odds favor the country making it the rest of the way without a violent tornado.
If and when that happens, it will be the first time since the modern record began in 1950.
Along the US East Coast, the Earth’s continued response to the end of the last ice age explains variances in relative sea level rates
Chestnut Hill, Mass. (12/20/2018) – Along the East Coast of the United States, relative sea level change does not happen uniformly between Maine and Florida.
Data have shown that sea level rise in the Mid-Atlantic region surpassed changes in relative sea level along the coastlines of the South Atlantic and the Gulf of Maine. A team of researchers took a look back at historical data through new analytical methods to pinpoint the reason behind the different rates of sea level change.
Assessing data from a range of sources and previous studies, the team concluded that the movement of the earth – referred to as vertical land motion – is the dominant force behind variations in rates of sea level rise up and down the East Coast, the team reports today in the journal Nature.
The L. A. Times published an article addressing a panel discussion at the latest U.N. climate alarmist confab in Poland touting protests by attendees regarding the need for continued use of fossil fuels.
I keep reading about all kinds of crazy schemes to reduce US CO2 emissions. Now, I don’t think that CO2 is the secret knob that controls the climate. I think that the earth has a host of emergent thermoregulatory mechanisms that act to keep the temperature within narrow limits (e.g. 0.6°C temperature change over the entire 20th Century). I don’t believe the claims that the modern changes in CO2 will affect the temperature.
But solely for the purposes of this post, let’s assume that the alarmists are correct. And for purposes of discussion only, let’s assume that the Earth’s temperature is free to go up and down any amount. Let’s assume that CO2 is, in fact, the secret control knob that controls the temperature of the earth. And let’s further assume that the pundits are right that the “climate sensitivity” is three degrees of warming for every doubling of CO2.
And finally, let’s assume that in 2018 the US magically stopped emitting any CO2 at all.
With all of those assumptions as prologue, here’s the question of interest.
Other things being equal, if the US stopped emitting CO2 entirely in 2018, and stayed at zero CO2 emissions indefinitely, how much cooler would that make the planet in the year 2050?
Five degrees cooler? Two degrees? One degree?
…
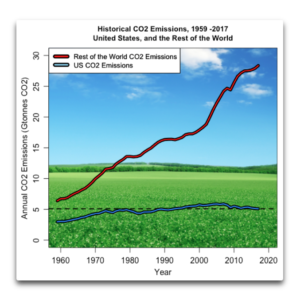
Figure 1. Historical CO2 emissions. Data from CDIAC and BP Statistical Review of World Energy
The “amazing” thing is that this isn’t a “new” oil discovery. It’s just a realization that a lot more oil and gas can be produced from these formations than was previously imagined.
The Permian Basin a nearly infinite resource. It seems as if there will always be more hydrocarbons to squeeze out of its numerous oil & gas reservoirs. From a Warmunist perspective the Bone Spring and Wolfcamp are much worse than previously thought…
New Mexico contains hundreds of historic uranium mines. Although active uranium mining in the state has ceased, rates of cardiovascular and metabolic disease remain high in the population residing close to mines within the Navajo Nation. According to a new study in ACS’ journal Environmental Science & Technology Letters, inhaled uranium in dusts from the mines could be a factor.
La géologie, une science plus que passionnante … et diverse