Stronger oil and natural gas prices combined with continuing development of shales and low permeability formations drove producers of crude oil and natural gas in the United States to report new all-time record levels of proved reserves for both fuels in 2017. Total U.S. oil reserves in 2017 exceeded a brief, one-year, 47-year-old record, highlighting the importance of crude oil development in shales and low permeability plays, mainly in the Southwest. The new record for natural gas extends a longer-term trend of development, mainly in shale plays in the Northeast. Both U.S. proved reserves of crude oil and natural gas are approximately double their levels from a decade ago. These new proved reserves records were established in 2017 despite production of crude oil at levels not seen since 1972, and record natural gas production.
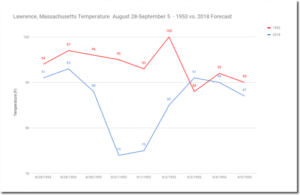
Talk about cold turkey! The coldest Thanksgiving in 100 years, and quite possibly the coldest Thanksgiving ever, has hit the Northeast United States today.
The unprecedented cold snap comes courtesy of a large Canadian chill working its way across the country on its way to the Atlantic. According to the Weather Network, the deep freeze is the result of a large, low pressure system moving south from the Arctic across the Great Lakes. Combine that with a wicked wind chill, and many Americans are looking at the coldest Thanksgiving in a century.
Chapter 6 – Temperature Changes in the United States of the U.S. Global Change Research Program’s recently published Climate Science Special Report (2017) clearly shows and discusses, under the heading of “6.1.2 Temperature Extremes”, how temperature extremes for the contiguous United States have become more moderate over the last 118 years, with the coldest daily temperatures warming and the warmest daily temperatures cooling. In other words, temperature-extreme-related climate in the United States has improved.
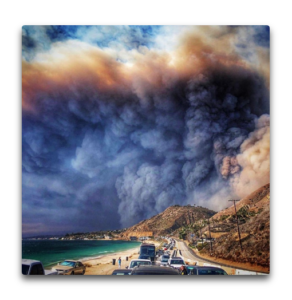
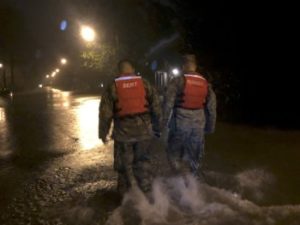
The Camp Fire that struck the northern California town of Paradise and vicinity is a profoundly disturbing environmental disaster of first magnitude. Nearly 100 people have lost their lives, approximately 10,000 homes have been lost, a major community has essentially been destroyed, and millions of people have been exposed to high concentrations of smoke. Tens of thousands of people have been displaced and lives of millions substantially affected.
And beyond the heart-wrenching losses noted above, it is doubly tragic that this disaster was both foreseeable and avoidable, resulting from a series of errors, poor judgment, lack of use of available technology, and poor urban planning.
It is more than unfortunate that some politicians, environmental advocacy groups, and activist scientists are attempting to use this tragedy as a tool for their own agenda, make the claim that the Camp Fire was result of global warming.
A few news items from The Shale Gas News, by Bill desRosiers of Cabot Oil & Gas. The main paragraphs below are adapted from desRosiers, but I’ve added some detail. Things are looking very good for the U.S. oil, gas and coal industries.
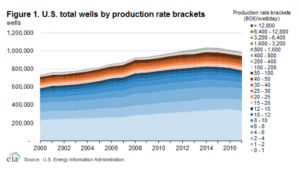
U.S. crude oil and natural gas production increased in 2017, with fewer wells. The total number of wells producing crude oil and natural gas in the United States fell to 991,000 in 2017, down from a peak of 1,039,000 wells in 2014. This recent decline in the number of wells reflects advances in technology and drilling techniques. EIA’s updated U.S. Oil and Natural Gas Wells by Production Rate report shows how daily production rates of individual wells contributed to U.S. total crude oil and natural gas production in 2017.
The well efficiency gains, in part, reflect an increase in the proportion of horizontal wells. The number of vertical wells decreased from 940,000 in 2014 to 864,000 in 2017. The number of horizontal wells increased from 99,000 in 2014 to 127,000 in 2017, an increase of 28%. This is important since only one percent of vertical wells produce 100 barrels of oil per day (BOPD) or more, but 30% of horizontal wells do. Typically, a horizontal well costs about twice as much as a vertical well to the same reservoir.
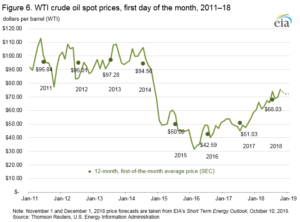
U.S. oil production grew from 10 million BOPD to 11 million BOPD between December 2017 and July 2018. Over the same period natural gas production grew from 97 BCF (billion cubic feet) to 100 BCF. Figures 1, 2, and 3 show the total number of wells drilled and the total oil and natural gas production.
Not all polar bears are in the same dire situation due to retreating sea ice, at least not right now. Off the western coast of Alaska, the Chukchi Sea is rich in marine life, but the number of polar bears in the area had never been counted. The first formal study of this population suggests that it’s been healthy and relatively abundant in recent years, numbering about 3,000 animals.
The study by researchers at the University of Washington and federal agencies is published Nov. 14 in Scientific Reports, an open-access journal from the Nature Publishing Group.
“This work represents a decade of research that gives us a first estimate of the abundance and status of the Chukchi Sea subpopulation,” said first author Eric Regehr, a researcher with the UW’s Polar Science Center who started the project as a biologist in Alaska with the U.S. Fish and Wildlife Service. “Despite having about one month less time on preferred sea ice habitats to hunt compared with 25 years ago, we found that the Chukchi Sea subpopulation was doing well from 2008 to 2016.
Over 8,000 homes and businesses have been reduced to ashes and rubble by the latest California conflagrations. Well over 60 people have perished, over 50,000 are homeless, hundreds remain missing. “This is the new abnormal,” Governor Jerry Brown insists. “Dryness, warmth, drought, all those things are going to intensify,” because of climate change. Even if we do more on forest management, that won’t stop climate change. “And those who deny that are definitely contributing to the tragedies.”
Those assertions have no basis in fact. The hard, incontrovertible reality is that California has always been a largely arid state, afflicted by prolonged droughts, interspersed with periods of intense rainfall, and buffeted almost every autumn by strong winds that can whip forest fires into infernos. The problem isn’t climate change. It’s ideological, even criminally incompetent forest management practices demanded by politicians, regulators, judges and environmentalists in recent decades. My article presents the real story.
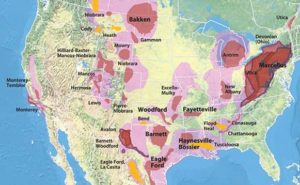
Popular accounts of shale oil and gas reservoirs are often riddled with errors and, even when technically correct, often misleading. As a shale petrophysicist, retired from Devon Energy, I thought I would try and explain, in a non-technical way, how these reservoirs work and why they have been so successful.
…
Figure 1. Major shale oil and gas plays in the United States. Source EIA.
Our charmingly incompetent California Governor, Jerry “Moonbeam” Brown, has announced that all climate-change deniers are “definitely contributing” to the wildfires in the northern and southern parts of the state over the past few days, as well as blazes “in the coming years.” So look out, you dang “deniers”, it’s all your fault!
…
So … did scientists actually “predict” that past temperatures have gone up by one degree? Can scientists actually predict the past? And can we really expect half a degree of warming in the next decade? To get some perspective on these questions, I thought I’d take a look at the records. I found an interesting site, the Western Regional Climate Center (WRCC), which has a variety of weather-related data state by state. So with no further ado, here is the average temperature in California from January of 1895 to the present, October 2018.
In light of the above findings, Coles et al. state the obvious, that the corals “were able to withstand elevated temperatures (31.4 °C) for a longer period of time in the current 2017 experiment” compared to the 1970 study. Consequently, they conclude that their results “indicate a shift in the temperature threshold tolerance of these corals to a 31-day exposure to 31.4 °C,” which findings “provide the first evidence of coral acclimatization or adaptation to increasing ocean temperatures.” And that observational reality should hold great bearing on the status and health of coral reefs in response to future climate change. If temperatures rise in the future, clearly, as living organisms, corals can (and do!) adapt. Alarmist predictions of their fast and ensuing demise due to global warming should not be taken too seriously.
by Liam Denning, November 1, 2018 in BloomberOpinion
The contrast between the success of the U.S. oil and gas industry and unpopularity in the stock market grows ever starker.
The Energy Information Administration released revised monthly figures for U.S. oil production on Thursday. The headline is that production is up — way, way up. It reached 11.35 million barrels a day in August, fully 2.1 million barrels a day higher than a year before. That’s almost like adding a whole new Mexico in the space of 12 months.
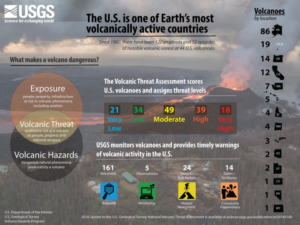
The United States has 161 young, active volcanoes within its borders. Since 1980, there have been 120 eruptions and 52 episodes of notable volcanic unrest at 44 U.S. volcanoes.
The U.S. Geological Survey systematically assesses U.S. volcanoes considered to be active or potentially active, and publishes a volcanic threat assessment that ranks the volcanoes based on 24 hazard and exposure factors. Last published in 2005, this 2018 update considers (1) field and laboratory research that adds or removes volcanoes from the list of potentially active volcanoes, and (2) updates the hazard and exposure factors used to produce a relative threat ranking of volcanoes.
The fast approaching solar minimum and its potential impact on the upcoming winter season
By Meteorologist Paul Dorian
Overview
In the long term, the sun is the main driver of all weather and climate and multi-decadal trends in solar activity can have major impacts on oceanic and atmospheric temperatures. In addition, empirical observations have shown that the sun can have important ramifications on weather and climate on shorter time scales including those associated with the average solar cycle of around 11-years. For example, there is evidence that low solar activity during solar minimum years tend to be well-correlated with more frequent “high-latitude blocking” events compared to normal and this type of atmospheric phenomenon can play an important role in the winter season.
…
his plot shows the daily observations of the number of sunspots during the last four solar cycles back to 1 January 1977 according to Solar Influences Data Analysis Center (SIDC). The thin blue line indicates the daily sunspot number, while the dark blue line indicates the running annual average. The current low sunspot activity is indicated by the arrow at the lower right of the plot. Last day shown: 30 Sep 2018. Data source: climate4you.com.
by J. Hopkins, September 28, 2018 in ClimateChageDispatch
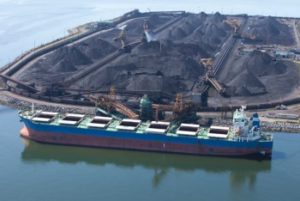
Foreign markets are lining up to purchase American coal by widening amounts as U.S. coal consumption reaches its lowest level in more than three decades.
Power plants’ consumption of coal dropped to 298 million short tons in the first half of 2018, a sharp fall from 312 million in the same period last year, according to a Thomson Reuters report.
This marks the lowest level of consumption since 1983 and a reflection of the coal industry’s declining status as natural gas continues to grow.
Coal-fired generation diminished by 32 billion kilowatt-hours during the first six months of 2018.
by H.S. Burnett, September 26, 2018 in ClimateChangeDispatch
…
Here are several facts that dispel these myths.
First, although the Atlantic hurricane season is not over yet, thus far, the number of hurricanes occurring this year is below average.
During a typical six-month Atlantic hurricane season, 12 named storms form, six become hurricanes, and three of those become major hurricanes – meaning Category 3 or higher.
This season, 10 named storms have formed in the Atlantic Basin, three of which became hurricanes.
Two other hurricanes briefly became minor storms off the west coast of Africa – and only Florence became a major hurricane.
Furthermore, only one has made landfall in the United States: Florence.
Before the above-average Atlantic hurricane season of 2017, the United States experienced the longest period in recorded history, nine years, without a major hurricane (Category 3 or higher) striking the country.
by M. Bastasch, September 19, 2018 in ClimateChangeDispatch
Hurricane Florence made landfall on Friday in North Carolina, bringing heavy rains and flooding. But before the storm touched down in the U.S., scientists and news outlets were already linking the storm to global warming.
However, not all scientists agree that man-made warming is making hurricanes, including Florence, bigger, slower and wetter as is often claimed in the media.
Climatologist Judith Curry called efforts by the “mainstream climate community” to link Florence to man-made global warming “woefully inadequate and misleading to scientists, the public and policymakers.”
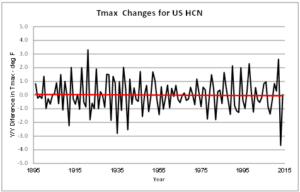
Given the impending global warming crisis declared by scientists, it should be easy to unambiguously demonstrate the crisis from the instrumental record. Unfortunately, when looking at the high temperature record for the US, it does not show any warming.
Figure 1 illustrates the incremental changes in surface air temperatures based on year to year differences in station average Tmax. The data is from all active stations in the US Historical Climatology Network (USHCN) from 1895 to 2014.
The classic heat equation defines changes in heat content as being proportional to changes in temperature (ΔQ = ƒ{ΔT} ).
Thus, Figure 1 amounts to a depiction of incremental changes in heat content, without scaling in energy units. The overall net temperature change is 0, which means the net change in heat content is also zero (ΔQ = ƒ{ΔT} = ƒ{0} = 0).
Figure 1 Year to Year Heat Changes (ΔT) for the USHCN
by F. Sotiropoulos, September 2018, in Stony Brook University/ published in Nature
The use of in-stream flow (or hydrokinetic) energy converters in rivers appears to offer another workable and effective option to expand renewable energy and limit carbon emissions in the United States. While the potential for in-stream flow energy harvesting systems has already been demonstrated for rivers with fixed beds, researchers now developed a scaled demonstration of hydrokinetic energy generated from a river channel with a sandy bed. Their findings, detailed in a new paper published in Nature Energy, showed that the model hydrokinetic power plant can generate energy effectively and safely without undermining the stability of the river geomorphic environment.
The playbook is well-known: After a drought, heat wave or flood occurs, journalists and climate alarmists fall all over themselves in the race to issue shrill warnings that this is only the beginning and that it is known that evil climate change is behind it.
This summer of 2018 we experienced again a Central European heat wave. However the usual alarmists failed again to provide any solid statistics on the frequency of heat waves during the last 100 and 1000 years.
Here we are glad to help out by presenting the latest results on heat wave trend in North America. Let’s begin with a spring heat wave in the USA in 2012 which was examined by Dole & Hoerling (2014) within a long-term context. The authors see a purely natural cause behind the unusual heat:
by Stephen Moore, August 20, 2018 in ClimateChangeDispatch
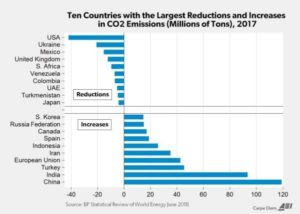
Take a wild guess what country is reducing its greenhouse gas emissions the most? Canada? Britain? France? India? Germany? Japan? No, no, no, no, no and no.
The answer to that question is the United States of America. Wow! How can that be? This must be a misprint. Fake news. America never signed the Kyoto Protocol some two decades ago.
Unconventional oil and gas exploration in the United States has experienced a period of rapid growth, followed by several years of limited production due to falling and low natural gas and oil prices. Throughout this transition, the water use for hydraulic fracturing and wastewater production in major shale gas and oil production regions has increased; from 2011 to 2016, the water use per well increased up to 770%, while flowback and produced water volumes generated within the first year of production increased up to 1440%. The water-use intensity (that is, normalized to the energy production) increased ubiquitously in all U.S. shale basins during this transition period. The steady increase of the water footprint of hydraulic fracturing with time implies that future unconventional oil and gas operations will require larger volumes of water for hydraulic fracturing, which will result in larger produced oil and gas wastewater volumes.
With wildfires engulfing over 620,000 acres of California, there’s been a concerted media campaign to single out man-made global warming as the primary force behind the deadly blazes.
But that’s not what the data suggests, according to University of Washington climate scientist Cliff Mass.
“So there is a lot of misinformation going around in the media, some environmental advocacy groups, and some politicians,” Mass wrote in the first of a series of blog posts analyzing the California wildfires.
One of the main difficulties with tornado records is that a tornado, or evidence of a tornado must have been observed. Unlike rainfall or temperature, which may be measured by a fixed instrument, tornadoes are short-lived and very unpredictable. If a tornado occurs in a place with few or no people, it is not likely to be documented. Many significant tornadoes may not make it into the historical record since Tornado Alley was very sparsely populated during the 20th century.
Much early work on tornado climatology in the United States was done by John Park Finley in his book Tornadoes, published in 1887. While some of Finley’s safety guidelines have since been refuted as dangerous practices, the book remains a seminal work in tornado research. The University of Oklahoma created a PDF copy of the book and made it accessible at John Finley’s Tornadoes(link is external)