Full-time professor at the Free University of Brussels, Belgium
apreat@gmail.com
apreat@ulb.ac.be
• Department of Earth Sciences and Environment
Res. Grp. - Biogeochemistry & Modeling of the Earth System
Sedimentology & Basin Analysis
• Alumnus, Collège des Alumni, Académie Royale de Sciences, des Lettres et des Beaux Arts de Belgique (mars 2013). http://www.academieroyale.be/cgi?usr=2a8crwkksq&lg=fr&pag=858&rec=0&frm=0&par=aybabtu&id=4471&flux=8365323
• Prof. Invited, Université de Mons-Hainaut (2010-present-day)
• Prof. Coordinator and invited to the Royal Academy of Sciences of Belgium (Belgian College) (2009-
present day)
• Prof. partim to the DEA (third cycle) led by the University of Lille (9 universities from 1999 to 2004) - Prof. partim at the University of Paris-Sud/Orsay, European-Socrates Agreement (1995-1998)
• Prof. partim at the University of Louvain, Convention ULB-UCL (1993-2000)
• Since 2015 : Member of Comité éditorial de la Revue Géologie de la France http://geolfrance.brgm.fr
• Since 2014 : Regular author of texts for ‘la Revue Science et Pseudosciences’ http://www.pseudo-sciences.org/
• Many field works (several weeks to 2 months) (Meso- and Paleozoic carbonates, Paleo- to Neoproterozoic carbonates) in Europe, USA (Nevada), Papouasia (Holocene), North Africa (Algeria, Morrocco, Tunisia), West Africa (Gabon, DRC, Congo-Brazzaville, South Africa, Angola), Iraq... Recently : field works (3 to 5 weeks) Congo- Brazzaville 2012, 2015, 2016 (carbonate Neoproterozoic).
Degree in geological sciences at the Free University of Brussels (ULB) in 1974, I went to Algeria for two years teaching mining geology at the University of Constantine. Back in Belgium I worked for two years as an expert for the EEC (European Commission), first on the prospecting of Pb and Zn in carbonate environments, then the uranium exploration in Belgium. Then Assistant at ULB, Department of Geology I got the degree of Doctor of Sciences (Geology) in 1985. My thesis, devoted to the study of the Devonian carbonate sedimentology of northern France and southern Belgium, comprised a significant portion of field work whose interpretation and synthesis conducted to the establishment of model of carbonate platforms and ramps with reefal constructions.
I then worked for Petrofina SA and shared a little more than two years in Angola as Director of the Research Laboratory of this oil company. The lab included 22 people (micropaleontology, sedimentology, petrophysics). My main activity was to interpret facies reservoirs from drillings in the Cretaceous, sometimes in the Tertiary. I carried out many studies for oil companies operating in this country.
I returned to the ULB in 1988 as First Assistant and was appointed Professor in 1990. I carried out various missions for mining companies in Belgium and oil companies abroad and continued research, particularly through projects of the Scientific Research National Funds (FNRS).
My research still concerns sedimentology, geochemistry and diagenesis of carbonate rocks which leads me to travel many countries in Europe or outside Europe, North Africa, Papua New Guinea and the USA, to conduct field missions.
Since the late 90's, I expanded my field of research in addressing the problem of mass extinctions of organisms from the Upper Devonian series across Euramerica (from North America to Poland) and I also specialized in microbiological and geochemical analyses of ancient carbonate series developing a sustained collaboration with biologists of my university. We are at the origin of a paleoecological model based on the presence of iron-bacterial microfossils, which led me to travel many countries in Europe and North Africa. This model accounts for the red pigmentation of many marble and ornamental stones used in the world. This research also has implications on the emergence of Life from the earliest stages of formation of Earth, as well as in the field of exobiology or extraterrestrial life ...
More recently I invested in the study from the Precambrian series of Gabon and Congo. These works with colleagues from BRGM (Orléans) are as much about the academic side (consequences of the appearance of oxygen in the Paleoproterozoic and study of Neoproterozoic glaciations) that the potential applications in reservoir rocks and source rocks of oil (in collaboration with oil companies).
Finally I recently established a close collaboration with the Royal Institute of Natural Sciences of Belgium to study the susceptibility magnetic signal from various European Paleozoic series. All these works allowed me to gain a thorough understanding of carbonate rocks (petrology, micropaleontology, geobiology, geochemistry, sequence stratigraphy, diagenesis) as well in Precambrian (2.2 Ga and 0.6 Ga), Paleozoic (from Silurian to Carboniferous) and Mesozoic (Jurassic and Cretaceous) rocks. Recently (2010) I have established a collaboration with Iraqi Kurdistan as part of a government program to boost scientific research in this country.
My research led me to publish about 180 papers in international and national journals and presented more than 170 conference papers. I am a holder of eight courses at the ULB (5 mandatory and 3 optional), excursions and field stages, I taught at the third cycle in several French universities and led or co-managed a score of 20 Doctoral (PhD) and Post-doctoral theses and has been the promotor of more than 50 Masters theses.
The latest IPCC report was a setup – a cynical ploy to produce alarmist media headlines that succeeded beautifully.
Seven days ago the Intergovernmental Panel on Climate Change (IPCC) issued a press release along with a summary of its new Special Report on Global Warming of 1.5°C.
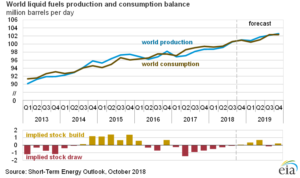
From the International Energy Agency’s Oil Market Report (OMR):
Home » Newsroom » News » 2018 » October
OMR: Twin Peaks
12 October 2018
Both global oil demand and supply are now close to new, historically significant peaks at 100 mb/d, and neither show signs of ceasing to grow any time soon. Fifteen years ago, forecasts of peak supply were all the rage, with production from non-OPEC countries supposed to have started declining by now.
by Cédric Moro, 15 octobre 2018 in MythesMancies&Mathématiques
Les discours alarmistes sur le climat ne datent pas d’hier. Grâce à la numérisation des archives audio-visuelles et à leur mise en ligne sur internet, il est possible aujourd’hui de démentir les prévisions climato-catastrophistes assénées de manière très officielle dans la deuxième moitié du siècle dernier. Beaucoup des déformations de nos discours sur la réalité tendent à puiser leurs racines dans nos représentations mentales du monde. Nous verrons donc que ces représentations alarmistes naissent dans un contexte idéologique nouveau : mutation de l’eugénisme, collapsologisme et décroissance.
The recently released IPCC SR15 reports (at A1) that global warming is likely to reach 1.5°C between 2032 and 2050 and (at B) will probably bring species extinction, weather extremes and risks to food supply, health and economic growth. If we are to avoid this, net CO2 emissions will need to decline by about 45% from 2010 levels by 2030, reaching net zero by 2050 (C1), followed by extensive removals (C5). The required energy investment alone will be $2.4 trillion per year.
Is this possible?
As at 2015, which was not materially different from 2010, more than half the planet’s total CO2 emissions (36Gt) were sourced from just three countries:
A new paper documents “remarkably different” land temperatures from one instrumental data set to another. In some regions there is as much as an 0.8°C conflict in recorded temperature anomalies for CRU, NASA, BEST, and NOAA. The relative temperature trend differences can reach 90% when comparing instrumental records. Consequently, the uncertainty in instrumental temperature trends — “0.097–0.305°C per decade for recent decades (i.e., 1981–2017)” — is as large or larger than the alleged overall warming trend itself for this period.
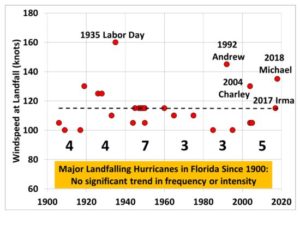
Sediment cores from Western Lake provide a 7000-yr record of coastal environmental changes and catastrophic hurricane landfalls along the Gulf Coast of the Florida Panhandle. Using Hurricane Opal as a modern analog, we infer that overwash sand layers occurring near the center of the lake were caused by catastrophic hurricanes of category 4 or 5 intensity. Few catastrophic hurricanes struck the Western Lake area during two quiescent periods 3400–5000 and 0–1000 14C yr B.P. The landfall probabilities increased dramatically to ca. 0.5% per yr during an “hyperactive” period from 1000–3400 14C yr B.P., especially in the first millennium A.D. The millennial-scale variability in catastrophic hurricane landfalls along the Gulf Coast is probably controlled by shifts in the position of the jet stream and the Bermuda High.
I’ve updated a plot of Florida major hurricane strikes since 1900 with Hurricane Michael, and the result is that there is still no trend in either intensity or frequency of strikes over the last 118 years:
Century-scale climate variability was enhanced when the Earth was warmer during the Last Interglacial period (129-116 thousand years ago) compared to the current interglacial (the last 11,700 years), according to a new UCL-led study.
The findings, published today in Nature Communications and funded by the Natural Environment Research Council (NERC) and the Australian Research Council (ARC), reveal that the Last Interglacial period was punctuated by a series of century-scale arid events in southern Europe and cold water-mass expansions in the North Atlantic.
Renewables developers eyeing Saudi Arabia remain wary of the market following the news that the world’s biggest solar project has been canceled.
The $200 billion, 200-gigawatt solar plant planned by SoftBank and the Saudi Public Investment Fund had raised skepticism among developers when it was announced in March, partly because of technical concerns over how it might be integrated into the grid.
The main worry, though, was that the megaproject appeared to have been approved independently of plans for an orderly ramp-up of solar through a tender program managed by the Saudi Renewable Energy Project Development Office (REPDO).
The significance of course is that the warming of the oceans began long before any impact from CO2 emissions.
HH Lamb has written extensively about how sea temperatures in the Atlantic fell radically during the LIA. Is the warming trend since then merely a return to earlier conditions?
Steve McIntyre has a look at the “revised” PAGES2K temperature proxy dataset that includes tree rings and river sediments. He finds the usual ridiculous problems from the past, such as upside down data and river sediment accumulations that have more to do with building a dam than climate.
The following description of the climate system contains nothing that is in the least controversial, and I expect that anyone with a scientific background will readily follow the description. I will also try, despite Snow’s observations, to make the description intelligible to the non-scientist.
…
…
Conclusion
So there you have it. An implausible conjecture backed by false evidence and repeated incessantly has become politically correct ‘knowledge,’ and is used to promote the overturn of industrial civilization. What we will be leaving our grandchildren is not a planet damaged by industrial progress, but a record of unfathomable silliness as well as a landscape degraded by rusting wind farms and decaying solar panel arrays. False claims about 97% agreement will not spare us, but the willingness of scientists to keep mum is likely to much reduce trust in and support for science. Perhaps this won’t be such a bad thing after all – certainly as concerns ‘official’ science.
There is at least one positive aspect to the present situation. None of the proposed policies will have much impact on greenhouse gases. Thus we will continue to benefit from the one thing that can be clearly attributed to elevated carbon dioxide: namely, its effective role as a plant fertilizer, and reducer of the drought vulnerability of plants. Meanwhile, the IPCC is claiming that we need to prevent another 0.5◦C of warming, although the 1◦C that has occurred so far has been accompanied by the greatest increase in human welfare in history. As we used to say in my childhood home of the Bronx: ‘Go figure’.
Media Matters scrutinized the top 50 U.S. newspapers between 9 AM and noon ET on Monday and found most did not mention on their website homepages the Intergovernmental Panel on Climate Change’s Sunday release of its report on the devastating impacts of a global temperature increase of 1.5-degree Celsius (2.7-degree Fahrenheit) above the temperature of the pre-industrial era.
by Bjorn Lomborg, October 10, 2018 in ClimateChangeDispatch
…
The IPCC report significantly underestimates the costs of getting to zero emissions. Fossil fuels provide cheap, efficient power, whereas green energy remains mostly uncompetitive.
Switching to more expensive, less efficient technology slows development. In poor nations that means fewer people lifted out of poverty.
In rich ones, it means the most vulnerable are hit by higher energy bills.
The IPCC says carbon emissions need to peak right now and fall rapidly to avert catastrophe.
Models actually reveal that to achieve the 2.7-degree goal the world must stop all fossil fuel use in less than four years.
Yet the International Energy Agency estimates that in 2040 fossil fuels will still meet three-quarters of world energy needs, even if the Paris agreement is fully implemented.
by JC Maurin, 4 octobre 2018 in Science,Climat,Energie
Pour les derniers millénaires, les proxies archives glaciaires montrent une corrélation entre rapport isotopique (« température ») et taux de CO2 subsistant dans les microbulles. Toutefois les valeurs numériques de taux de CO2 doivent être prises avec précaution: l’enregistrement comporte à minima un biais « passe bas » qui efface les extremums. Si la corrélation est bien réelle, en revanche des affirmations telles que « les taux de CO2 des derniers millénaires sont toujours inférieurs aux taux après 1958 », ou bien « une variation de 1°C entraîne une variation de 12 ppm » ne sont pas démontrées.
Le CO2 ne précède jamais l’augmentation de la température, et cela depuis au moins le Pléistocène (240 000 ans) où la démonstration a bien été établie (cf. Fig. 8). Le CO2 n’est donc pas le ‘bouton’ contrôlant l’évolution de la température.
Les concentrations anciennes de CO2 atmosphérique sont sous-estimées et les données de Vostok non seulement donnent un ‘ background’ plus faible que les données fournies par l’analyse des stomates (Fig.10,) mais ne voient pas les pics de concentrations plus élevés de CO2. Ainsi affirmer que les teneurs actuelles en CO2n’ont jamais été aussi élevées, même à une échelle géologique très restreinte (telle que Quaternaire) est trompeur.
Pour les dernières décennies, les mesures contemporaines montrent une corrélation entre température de surface des océans sous les tropiques et variation annuelle du taux de CO2. La variation annuelle c’est aussi la différence entre entrées et sorties. Les mesures contemporaines montrent également une corrélation entre température des océans sous les tropiques et variation annuelle du δ13C. Ces 2 corrélations sont nettes lors des forts épisodes El Niño de 1998 et 2016.
Nous exploiterons ces corrélations dans la troisième partie qui montrera que le modèle anthropique du GIEC n’est pas en accord avec les mesures du δ13C et ne peut rendre compte des évolutions récentes du CO2 .
by B. Peiser, October 10, 2018 in ClimateChangeDispatch
So the very first sentence of the SR15 Summary for Policy Makers, after the Introduction, consists of a statement which is not well supported by the totality of the available scientific literature and which is at odds with the IPCC’s own findings in the AR5 Working Group 1 Report of just 5 years ago! Not a good start. —Climate Scepticism, 9 October 2018
by P. Homewood, October 10, 2018 in NotaLotofPeopleKnowThat
Contrary to recent press reports that the oceans hold the still-undetected global atmospheric warming predicted by climate models, ocean warming occurs in 100-year cycles, independent of both radiative and human influences.
At a press conference in Washington, D.C., on March 24, 2000, Dr. James Baker, Administrator of the U.S. National Oceanic and Atmospheric Administration (NOAA), announced that since the late 1940s, there “has been warming to a depth of nearly 10,000 feet in the Atlantic, Pacific, and Indian Oceans.” “In each ocean basin, substantial temperature changes are occurring at much deeper depths than we previously thought,” Dr. Baker said, as indicated by research conducted at NOAA’s Ocean Climate Laboratory. He was referring to a paper published in Science magazine that day, prepared by Sydney Levitus, John Antonov, Timothy Boyer, and Cathy Stephens, of the NOAA Center.
For 15 years, modellers have tried to explain their lack of success in predicting global warming. The climate models had predicted a global temperature increase of 1.5°C by the year 2000, six times more than that which has taken place. Not discouraged, the modellers argue that the heat generated by their claimed “greenhouse warming effect” is being stored in the deep oceans, and that it will eventually come back to haunt us. They’ve needed such a boost to prop up the man-induced greenhouse warming theory, but have had no observational evidence to support it. The Levitus, et al. article is now cited as the needed support.
The fate of the planet is at stake, but the key temperature data set used by climate models contains more than 70 different sorts of problems. Trillions of dollars have been spent because of predictions based on this data – yet even the most baby-basic quality control checks have not been done.
Thanks to Dr John McLean, we see how The IPCC demands for cash rest on freak data, empty fields, Fahrenheit temps recorded as Celsius, mistakes in longitude and latitude, brutal adjustments and even spelling errors.
Why. Why. Why wasn’t this done years ago?
So much for that facade. How can people who care about the climate be so sloppy and amateur with the data?
L’ écologie a renoué avec l’environnement le lien fondamental et sacré qui le relie à l’homme. Par cette communion, elle remplit le vide laissé par les religions dans un contexte d’explosion technologique. Mais elle fait semblant d’ignorer que le fossé s’élargit de toutes parts entre la déclinaison politique de ses principes et le bilan de ses résultats.
La dimension mondiale du phénomène et les sommes inédites qui lui sont consacrées justifient une tentative d’analyse de son origine et de sa démarche, ainsi que de ses ressorts cachés et des conséquences géopolitiques qu’on peut en attendre.
Ces 2 faces de l’écologie politique sont l’objet des 2 parties du présent article.
Even long before medieval inhabitants reclaimed land and raised dykes at a large scale, humans have had a strong impact on river behavior in the Dutch delta plain. Physical geographers have demonstrated that two present Rhine branches developed stepwise in the first centuries CE, because of two combined man-induced effects.
The following description of the climate system contains nothing that is in the least contro- versial, and I expect that anyone with a scientific background will readily follow the descrip- tion. I will also try, despite Snow’s observations, to make the description intelligible to the non-scientist.
by P. Homewood, October 9, 2018 in NotaLotofPeopleKnowThat
Some of my initial thoughts:
The topic of climate change is not a simple black and white one, and there are many areas where there is substantial disagrement among scientists. However the official party line pretends this is not the case.
It is generally accepted that there has been some warming since the end of the little ice age in the 19thC. But how much is natural, and how much man made?
The LIA is reckoned to be the coldest era since the ice age, so it is reasonable to assume that at least part of the warming since is natural.
The Nongovernmental International Panel on Climate Change (NIPCC) is what its name suggests: an international panel of nongovernment scientists and scholars who have come together to understand the causes and consequences of climate change. Because we are not predisposed to believe climate change is caused by human greenhouse gas emissions, we are able to look at evidence the Intergovernmental Panel on Climate Change (IPCC) ignores. Because we do not work for any governments, we are not biased toward the assumption that greater government activity is necessary.
NIPCC traces its roots to a meeting in Milan in 2003 organized by the
Science and Environmental Policy Project (SEPP), a nonprofit research and education organization based in Arlington, Virginia. SEPP, in turn, was founded in 1990 by Dr. S. Fred Singer, an atmospheric physicist, and incorporated in 1992 following Dr. Singer’s retirement from the University of Virginia. NIPCC is currently a joint project of SEPP, The Heartland Institute, and the Center for the Study of Carbon Dioxide and Global Change.
The Intergovernmental Panel on Climate Change (IPCC) issued a press release today. It tells us the IPCC assesses “thousands of scientific papers published each year,” and that its latest report relies on “more than 6,000 references.”
…
We therefore have no earthly reason to imagine that climate science is exempt from these kinds of problems.
If half of the scientific literature is untrue, it therefore follows that half of climate research is also untrue.
This means that 3,000 of the IPCC’s 6,000 references aren’t worth the paper they’re written on.
…
La géologie, une science plus que passionnante … et diverse