by P. Gosselin, Oct 24, 2025 in NoTricksZone
This is not supposed to be happening, according to the climate models.
While the headlines relentlessly holler about “exploding global warming” and “dramatic melting” of the polar caps, the South Pole is telling a starkly different story.
Here reports Germany’s Report 24.
On October 15, the Amundsen-Scott South Pole Station registered an astonishing temperature of minus 61.3 degrees Celsius and it isn’t even winter there. It’s springtime and temperatures should be on the rise.
Coldest October since 1981
According to Report 24, the numbers are clear: It was the coldest October measured at the station since 1981.
This extreme cold is not an isolated event. As the article points out, even CNN reported in 2021 that the continent had experienced its coldest winter since records began.
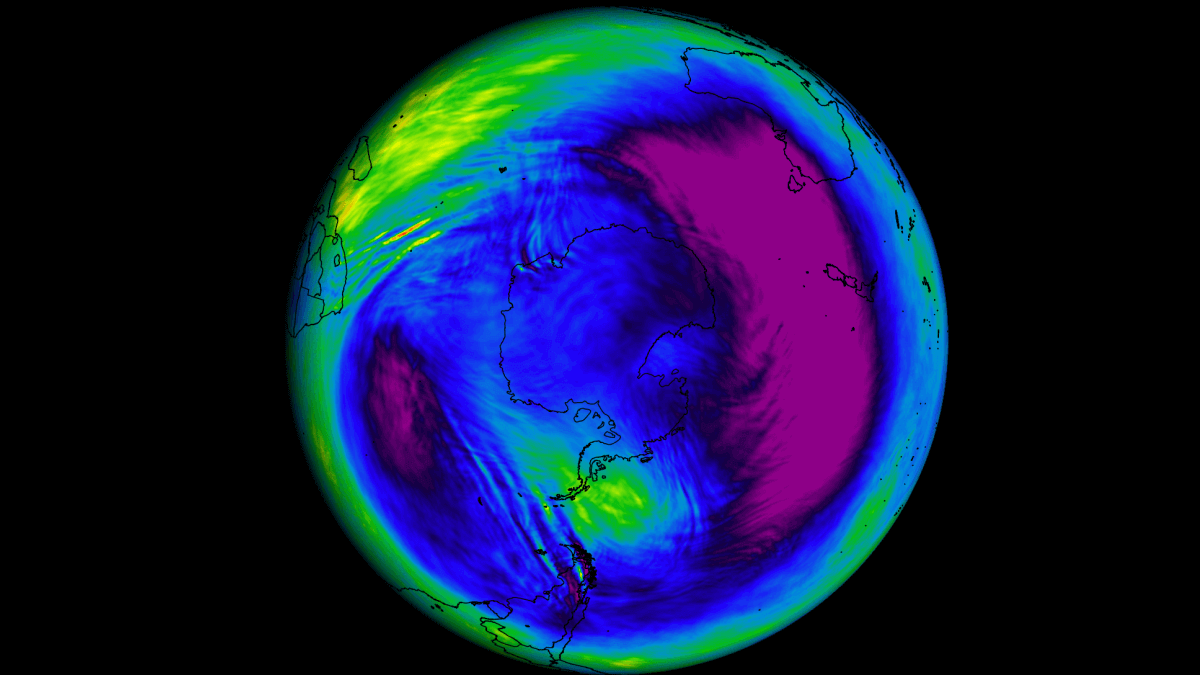
The data from stations like Amundsen-Scott, Vostok, and Dome C show that instead of a linear, CO₂-driven heating trend, the South Pole is dominated by naturally occurring, extreme temperature fluctuations, including pronounced cold snaps.
Natural factors dominate
This directly contradicts the dominant narrative that “extreme heat is the new normal” and challenges the core assumption that the trace gas CO₂ is the overwhelming, all-determining factor in our climate system. Climatological mechanisms like stratospheric waves, polar vortex stability, and cloud cover appear to be the actual drivers of weather events.
Even growing colder
For decades, we’ve been told that polar regions would experience the strongest warming. Yet, the Antarctic region has stubbornly resisted, in some parts even growing colder.
The Report 24 article argues that this recurring cold record is a “nail in the coffin of the CO₂ dogma.” If carbon dioxide were truly the dominant climate control knob, such an extreme, decades-long cold minimum shouldn’t be happening.
The underlying models—like the IPCC forecasts from the 1990s—have systematically overestimated temperature trends. When faced with such real-world deviations, one must ask: are the climate models flawed, or is the CO₂-centric theory of climate incomplete?
For those politicians and policymakers who are basing sweeping, economy-altering decisions on the idea that the “science is settled,” the stubborn cold of the South Pole presents a critical challenge that can no longer be ignored.