
by K. Richard, Oct 2, 2025 in NoTricksZone
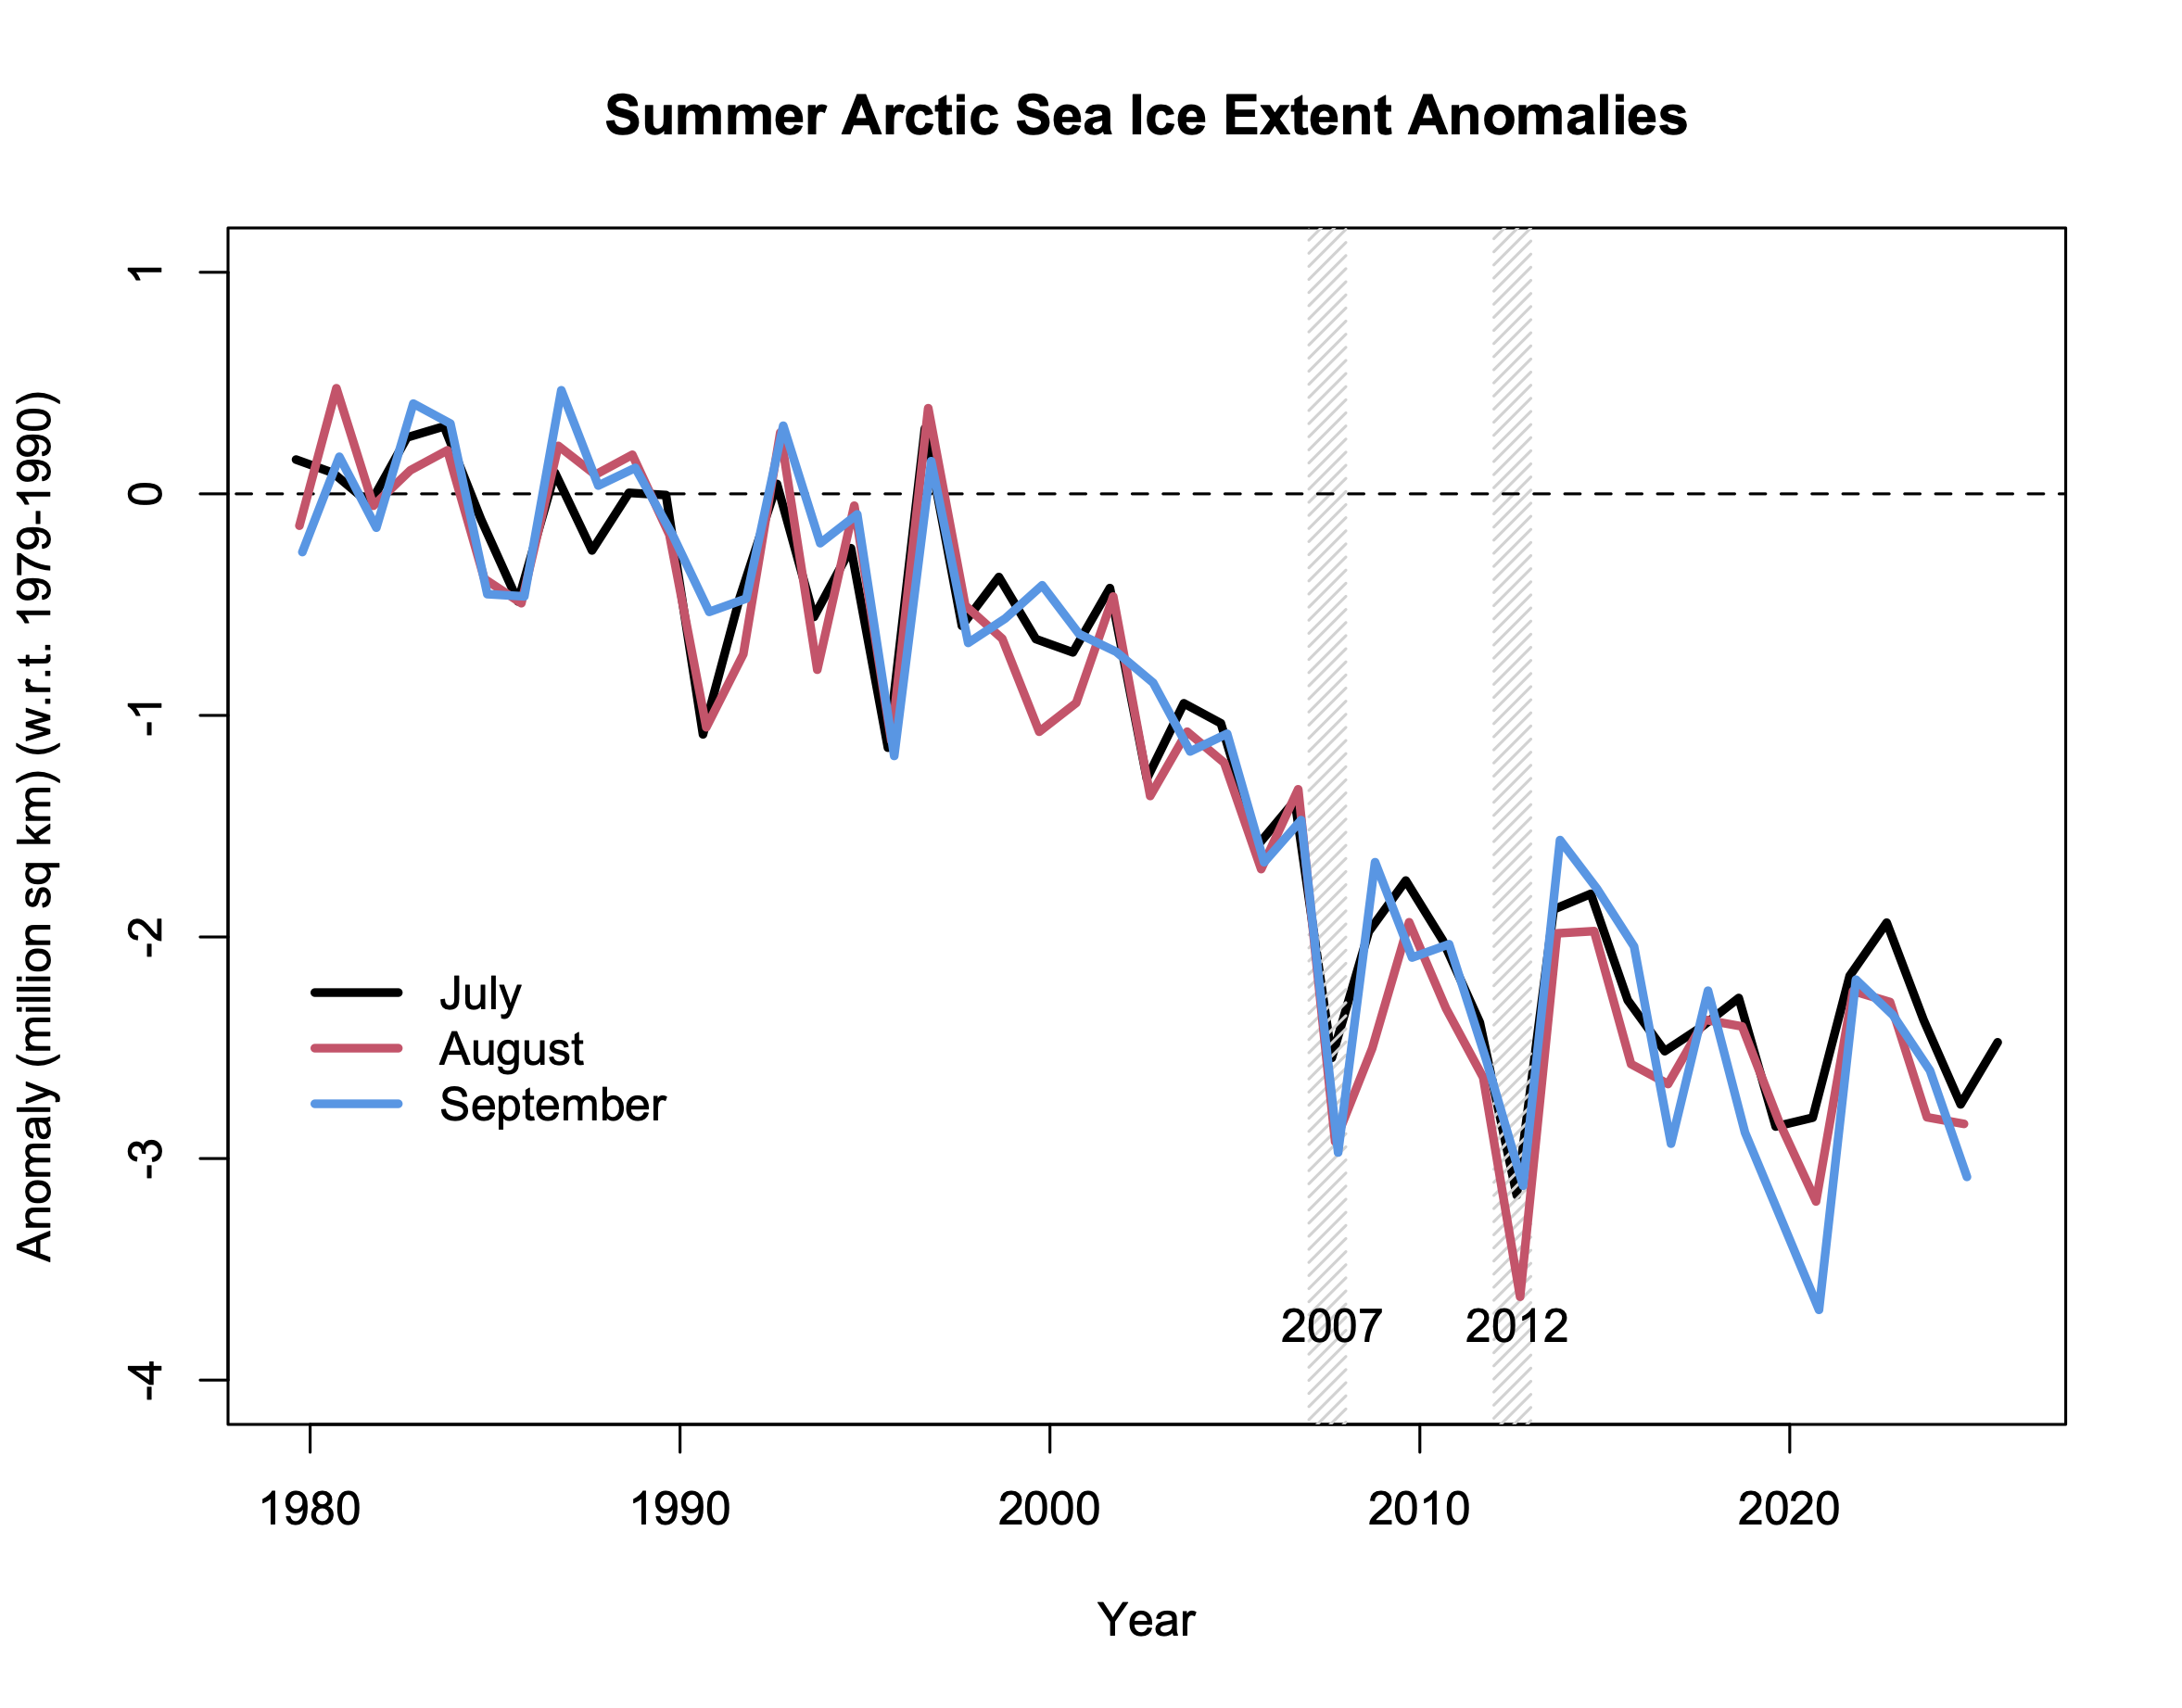
“Observations show no significant decline in Arctic sea ice concentration (SIC) since 2012…revealing a negligible trend of -0.4% per decade…” – Wang et al., 2025
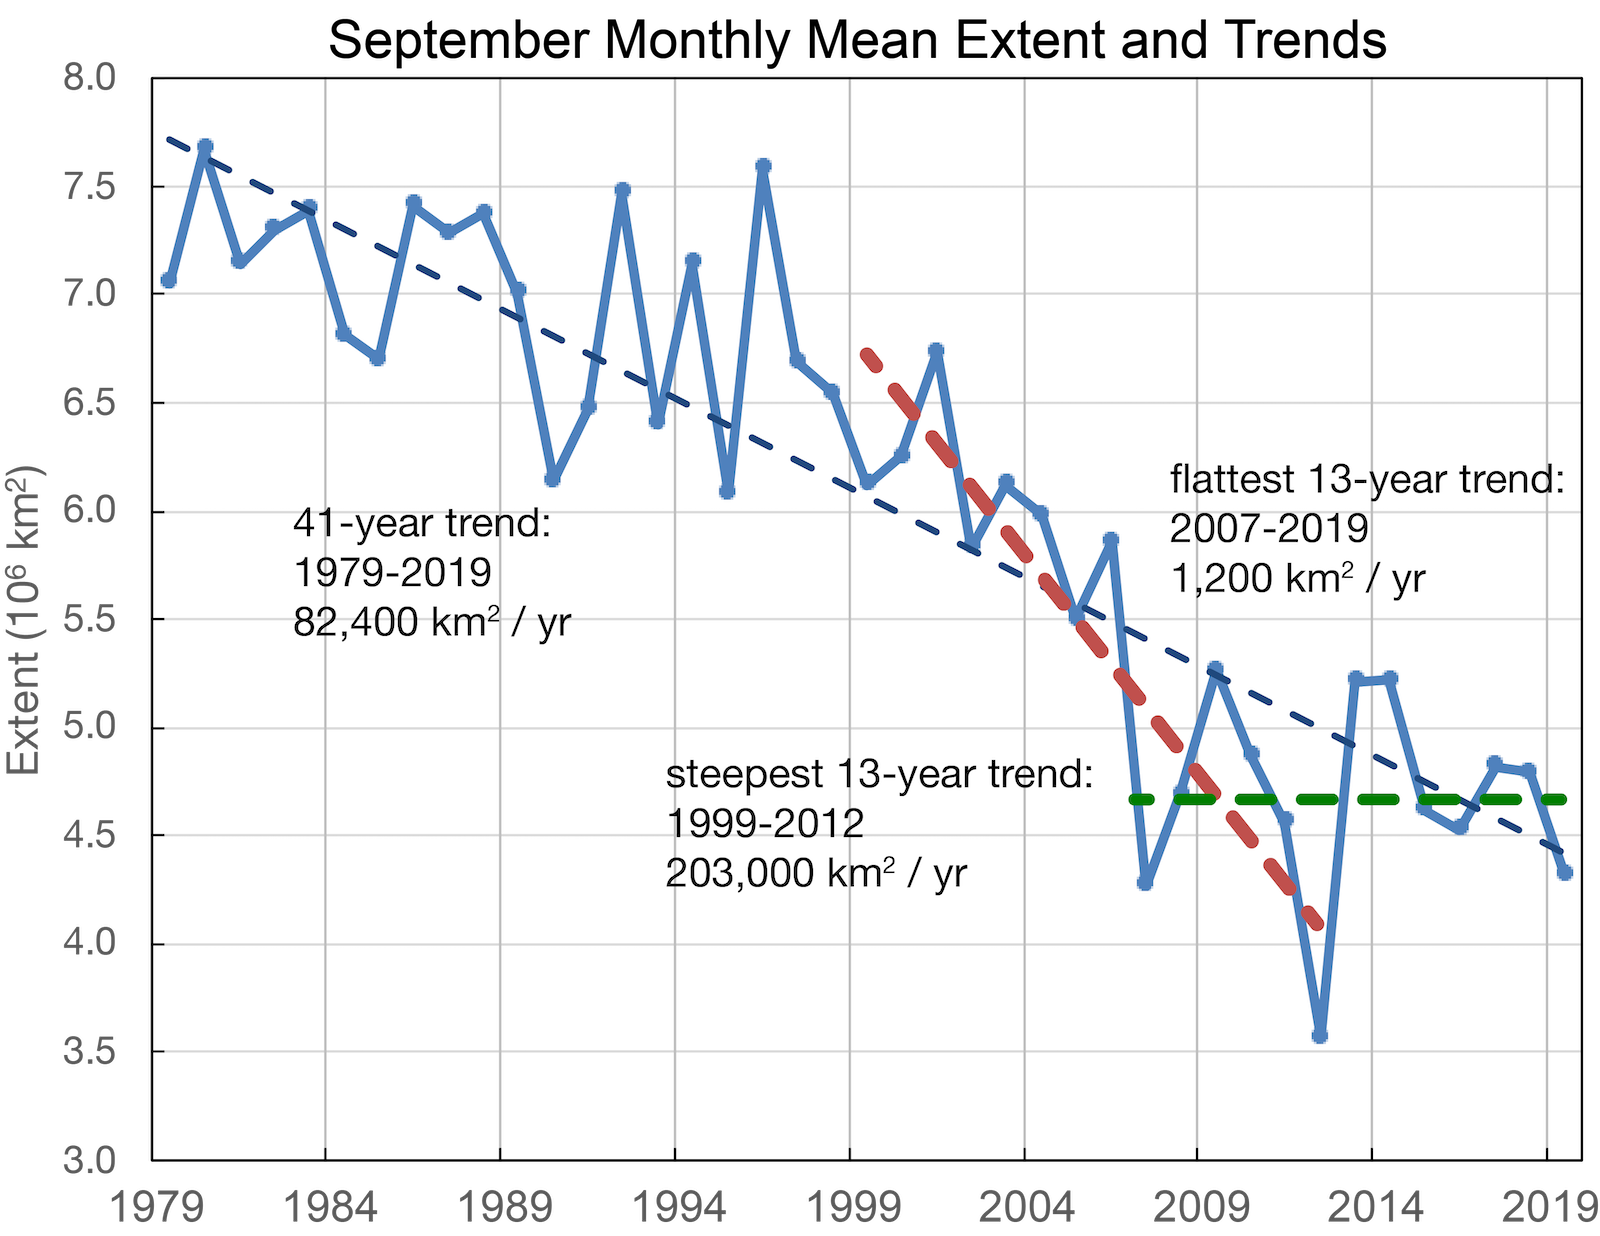
Scientists are now acknowledging the sharply declining trend in Arctic sea ice from the mid-1990s to 2010s (-11.3% per decade), as well as the “negligible” or flat trend since 2012 (-0.4% per decade) are both “closely coupled” with natural decadal-scale variations in the North Atlantic Oscillation, the Atlantic Multidecadal Oscilliation, and “enhanced summertime radiation balance associated with an anticyclonic atmospheric circulation pattern.”
In other words, instead of a linear decline in Arctic sea ice coupled with rising greenhouse gas emissions, it is claimed that “approximately half” of the observed Arctic sea ice decline in the modern era can be attributed to internal variability.
The authors of this new study published in Nature Communications further suggest the flattened trend or “slowdown” in sea ice decline will likely persist for the next 10 to 15 years. Consequently, alarmist predictions of an “ice-free” Arctic in the coming decades will have to be put on hold until after the 2030s.


