Archives de catégorie : climate-debate

Inconvenient Climate Study Censored

by P. Homewood, Jan 14, 2025 in NotaLotofPeopleKnowThat


Another important paper taking issue with the ‘settled’ climate narrative has been cancelled following a report in the Daily Sceptic and subsequent reposts that went viral across social media. The paper discussed the atmospheric ‘saturation’ of greenhouse gases such as carbon dioxide and argued that higher levels will not cause temperatures to rise. The work was led by the widely-published Polish scientist Dr. Jan Kubicki and appeared on Elsevier’s ScienceDirect website in December 2023. The paper has been widely discussed on social media since April 2024 when the Daily Sceptic reported on the findings. Interest is growing in the saturation hypothesis not least because it provides a coherent explanation for why life and the biosphere grew and often thrived for 600 million years despite much higher atmospheric levels of greenhouse gases. Alas for control freaks, it also destroys the science backing for the Net Zero fantasy.

Read the full story here.

3 More New Drought And Temperature Reconstructions Do Not Support The Climate Alarm Narrative

by K. Richard, Jan 13, 2025 in NoTricksZone


Studies from Central China, Russia, and Central Europe indicate there was just as much (0r more) warming and drought prior to 1900, or when CO2 concentrations were under 300 ppm.

A new 1606 to 2016 Central China winter (minimum) temperature reconstruction (Jiang et al., 2024) reveals cold periods only occurred in 9 years of the 1600s (1663-1672), but there were 71 years of cold periods during the 20th century (1900-1942, 1959-1979, 1985-1994).

Notably, CO2 hovered around 278 ppm during the 1600s and 1700s, but it rose from 290 ppm to 370 ppm during the 1900s.

From 1650-1750 the winter temperatures in Central China were 0.44°C warmer than they were during the 20th century. The authors were surprised by this temperature result, as 1650-1750 falls within the timing of the Little Ice Age.

“Surprisingly, during 1650–1750, the lowest winter temperature within the research area was about 0.44 °C higher than that in the 20th century, which differs significantly from the concept of the ‘cooler’ Little Ice Age during this period. This result is validated by the temperature results reconstructed from other tree-ring data from nearby areas, confirming the credibility of the reconstruction.”

Finally, it should be noted that the year 1719 was 1.4°C warmer (-3.17°C) than the 1961-2016 average (-4.57°C).

A new 1803-2020 Central Europe precipitation reconstruction (Nagavciuc et al., 2025) determines droughts were more prolonged and pronounced during the 1800s than in the 1900s, as the 1900s were relatively wet. Only one recent period (2007-2020) endured extreme drought, but it did not exceed the severity of the 1818–1835, 1845–1854, 1882–1890 drought years.


Met Office Try To Shut Down Debate On Junk Temperature Measurements

by P. Homewood, Jan 7, 2025 in NotaLotofPeopleKnowThat


hris Morrison has the latest on how the Met Office, in league with the green blob, are trying to shut down debate on the junk weather station scandal:

image

After a year of damaging revelations about the state of the Met Office’s temperature measuring network, the Green Blob-funded ‘fact-checker’ Science Feedback has sprung to the defence of the state-funded U.K. weather service. It has published a long ‘fact check’ seeking to exonerate practices that have recently come to light including the locating of stations with huge heat corrupted ‘uncertainties’ and the publication of invented data from 103 non-existent sites. Inept is a word that springs to mind. At one point, Science Feedback justifies the estimation of data at the non-existent stations by referring to the hastily changed Met Office explanation for station/location long-term averages. The original and now deleted Met Office webpage referenced station names and provided single location coordinates including one improbable siting next to the sea on Dover beach. This would appear to be a new low in the world of so-called fact-checking – designating copy as ‘misleading’ based on an explanation changed after the article was published.

Full story here.

England & Wales Rainfall Trends

by P. Homewood, Jan 8, 2025 in NotaLotofPeopleKnowThat


image

https://www.metoffice.gov.uk/hadobs/hadukp/data/monthly/HadEWP_monthly_totals.txt

It does not need me to tell you that it was quite wet last year. It was in fact ninth wettest in England & Wales since 1766, though nowhere near the two wettest years in 1872 and 1768.

For the last decade or so, we have been going through the same sort of weather as in the 1870s and 80s, as well as the 1920s.

But averages and trends are not particularly meaningful – nature does not do averages and straight lines! You could have ten years all with the same rainfall, or you could have five years with high rainfall and five years of drought, and you could get the same average.

If you just look at the distribution of wet years, there is no obvious pattern:

Climate Bombshell: New Evidence Reveals 30 Year Global Drop in Hurricane Frequency and Power

by C. Morrison, Jan 4, 2025 in DailySceptic


Last month a small but powerful cyclone named Chido made landfall in Mayotte before sweeping into Mozambique, causing considerable damage and leading to the loss of around 100 lives. Days after the tragedy, the Green Blob-funded Carbon Brief noted that scientists have “long suggested” that climate change is making cyclones worse in the region, while Blob-funded World Weather Attribution (WWA) at Imperial College London made a near-instant and curiously precise estimate that a Chido-like cyclone was about 40% more likely to happen in 2024 than during the pre-industrial age. Not to be outdone, Green Blob-funded cheerleader the Guardian chipped in with the obligatory “cyclones are getting worse because of the climate emergency”. Almost unnoticed, it seems, among all the Net Zero dooming and grooming was a science paper published during December by Nature that found no increase in the destructive power of cyclones – the generic term for typhoons and hurricanes – in any ocean basin over the last 30 years. In the South Indian basin, the location of cyclone Chido, there was a dramatic decrease in both frequency and duration in recent times.

Reality rarely gets much of a look-in these days when fanatical Net Zero activism is afoot, but the paper, written by a group of Chinese meteorologists, makes its case by considering the facts and the data. The scientists apply a “power dissipation index” (PDI) which they consider superior to single measure indicators since it combines storm intensity, duration and frequency. The graphs below show the cumulative index for tropical cyclones across all ocean basins along with a global indication.

UK Temperatures In 2024

by P. Homewood, Jan 5, 2025 in NotaLotofPeopleKnowThat


UK annual temperatures have dropped for the second year running, though the Met Office will emphasise what they claim is a remorseless upwards trend. However they don’t show error margins in their graphs, and as we know, nine out of ten of the weather stations used for their UK temperature dataset are junk or near junk sites, where poor siting can mean temperatures may be overstated by as much as five degrees for Class 5 and two degrees for Class 4:

Central Greenland Was Recently Ice-Free And Covered With Plants When CO2 Was Under 300 ppm

by K. Richard, Jan 3, 2025 in NoTricksZone


Today, with CO2 levels supposedly in the “dangerously high” range, Central Greenland has 3 kilometers of ice piled atop it.

Scientists have known since the GISP2 borehole was drilled in 1993 that Central Greenland deglaciated at least once in the late Pleistocene (Bierman et al., 2024). Indeed, the Summit of the modern Greenland ice sheet was actually ice-free at some point between 250,000 and 1.1 million years ago – which is relatively recent from a geological perspective.

Plants, wood, insects, fungi and other remnants suggestive of vegetation were recovered from the bottom of the boring site. This is quite a contrast to today’s 3000-meters-high ice sheet at this same location.

“The presence of poppy, spike-moss, fungal sclerotia, woody tissue, and insect parts in the GISP2 till shows that tundra vegetation once covered central Greenland, mandating that the island was largely ice-free.”

The atmospheric CO2 concentration is presumed to have ranged between 275 and 290 ppm during the Late Pleistocene, or during this same period when Greenland was ice-free. These sub-300 ppm CO2 levels are thought to be the same as they were from 1700 to 1900 (the Little Ice Age), when, as today, Central Greenland has remained buried in kilometers of ice.

The authors of this study use existing knowledge of Greenland’s climate (for example, Summit’s mean July temperature is -7°C) to calculate how much warmer Central Greenland was “when the ice was gone” during the last 1.1 million years. Controlling for lapse rate, Central Greenland’s average surface air temperatures were likely +3 to 7°C in July when it had no ice sheet.

The atmospheric CO2 concentration thus appears to be largely unrelated to either Greenland’s climate or its state of glaciation.

UAH v6.1 Global Temperature Update for December, 2024: +0.62 deg. C

by R. Spencer, Jan 3, 2025 in WUWT


2024 Sets New Record for Warmest Year In Satellite Era (Since 1979)

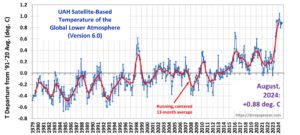
The Version 6.1 global average lower tropospheric temperature (LT) anomaly for December, 2024 was +0.62 deg. C departure from the 1991-2020 mean, down slightly from the November, 2024 anomaly of +0.64 deg.

The Version 6.1 global area-averaged temperature trend (January 1979 through December 2024) remains at +0.15 deg/ C/decade (+0.22 C/decade over land, +0.13 C/decade over oceans).

As seen in the following ranking of the years from warmest to coolest, 2024 was by far the warmest in the 46-year satellite record averaging 0.77 deg. C above the 30-year mean, while the 2nd warmest year (2023) was +0.43 deg. C above the 30-year mean. [Note: These yearly average anomalies weight the individual monthly anomalies by the number of days in each month.]

10 Steps Trump Can Take To Restore America’s Energy Dominance

by D. Blackmon, Jan 2, 2025 in ClimateChangeDispatch


President-elect Donald Trump has a big job ahead of him in restoring common sense and sanity to federal energy policy when he takes office on January 20. [emphasis, links added]

The last four years in this realm can more accurately be characterized as a series of ill-considered, irrational scams than as any sort of coherent, productive set of policies.

It has been four years of bad policies — largely based on crass crony capitalism principles — that have done severe damage to America’s level of energy security.

No doubt cleaning up this mess left behind by President Joe Biden and his appointees will take the full four years of Trump’s second term. But the new president will be able to take some fast actions to jump-start the process as part of his first 100-day agenda.

With respect, here is a list of 10 quick common-sense actions Trump can take to begin to restore America’s energy security:

1 — Rescind Biden’s ridiculous permitting “pause” on LNG export infrastructure. Of all the Biden energy policy scams, this was perhaps the most heinous and unjustified of all. Terminate it immediately and get this American growth industry back on track.

2 — Terminate U.S. participation in the Paris Climate Agreement and any future annual COP conferences sponsored by the United Nations. Halt the spending of federal dollars related to any and all goals and commitments related to either of these wasteful processes.

3 — Terminate the office of Senior Advisor to the President for International Climate Policy, aka “the Climate Envoy,” currently occupied by John Podesta, and eliminate its budget.

Wind And Solar: The Hidden Truth Behind Those Rising Electric Bills

by Bjorn Borg, Jan 2, 2025 in ClimateChangeDispatch


Green Electricity Really Does Cost A Bundle

As nations use more and more supposedly cheap solar and wind power, a strange thing happens: Our power bills get more expensive. [emphasis, links added]

This exposes the environmentalist lie that renewables have already outmatched fossil fuels and that the “green transition” is irreversible even under a second Trump administration.

The claim that green energy is cheaper relies on bogus math that measures the cost of electricity only when the sun is shining and the wind is blowing.

Modern societies need around-the-clock power, requiring backup, often powered by fossil fuels. That means we’re paying for two power systems: renewables and backup.

Moreover, as fossil fuels are used less, those power sources need to earn their capital costs back in fewer hours, leading to even more expensive power.

This means the real energy costs of solar and wind are far higher than what green campaigners claim. One study shows that in China the real cost of solar power on average is twice as high as that of coal.

Similarly, a peer-reviewed study of Germany and Texas shows that solar and wind are many times more expensive than fossil fuels.

Germany, the U.K., Spain, and Denmark, all of which increasingly rely on solar and wind power, have some of the world’s most expensive electricity.

The International Energy Agency’s latest data (from 2022) on solar and wind power generation costs and consumption across nearly 70 countries shows a clear correlation between more solar and wind and higher average household and industry energy prices.

In a country with little or no solar and wind, the average electricity cost is about 12 cents a kilowatt-hour (in today’s money).

For every 10% increase in solar and wind share, the electricity cost increases by more than 5 cents a kilowatt-hour.

This isn’t an outlier; these results are substantially similar to 2019, before the effects of the pandemic and the war in Ukraine.

For every 10% increase in solar and wind share, the electricity cost increases by more than 5 cents a kilowatt-hour.

Recent Temperature Falls Likely to Put a Dampener on ‘Hottest Year Evah’ Stories

by C. Morrison, Dec 28, 2024 in TheDailySceptic


Stand by for another bout of ‘Hottest Year Evah’ stories as the mainstream media pursues its campaign to induce mass climate psychosis and prepare the ground for the oncoming Net Zero catastrophe. Alas, enjoy it only a little while longer since this story may have to be retired after putting in such a sterling propaganda shift. Global temperatures are falling like a stone, while the oceans are cooling at a remarkably rapid rate. In the U.K., the year is likely to show a second annual temperature fall since the alleged ‘record’ year in 2022.

Only last May, Matt McGrath and Justin Rowlatt at the BBC were claiming that “fuelled by climate change” the world’s oceans had broken temperature records every single day over the past year. Planet-warming gases were said to be “mostly to blame”. Three days were singled out when the previous highs were beaten by 0.34°C. Inexplicably, the story, a matter it might be thought of some ongoing concern, was not followed up. The graph below, compiled from data supplied by the U.S. weather service NOAA, might help explain why.

Habitat Destruction Offsets for “Renewables” are just Indulgences

by D. Wojick, Dec 28, 2024 in WUWT


A bad idea is emerging in the “renewables” world, namely that projects can buy their way out of destroying natural habitats. The wind and solar projects still destroy the natural habitats they are built on but they fund a magic wand that somehow supposedly creates new compensating habitat someplace else. Not really.

The fallacy here is that every acre in America already has a habitat. You can change an acre’s habitat from one form to another but not create one. It is a zero sum game.

There is a long standing, highly specialized development offset program that helps make the point. This is wetlands protection under section 404 of the Clean Water Act. Wetlands are deemed to be so special that filling one in for development can be offset by creating one someplace else.

But if you convert dry land to wetland you have destroyed the dry land habitat. So the amount of habitat destruction is not reduced, just the amount of wetland destruction.

The supposed renewables habitat destruction offset does nothing like the 404 program. The renewables developer simply pays to have habitat created someplace else which is impossible. For reference these programs are often called Biodiversity Offsetting which sounds nice.

Such a program might create habitat somewhere that matches that destroyed by the renewables project but that requires destroying the present habitat of the offset site. For example creating a woodland by destroying a grassland. Or vice versa, bulldozing a forest to create a grassland. This might even mean destroying farmland.

Clearly this is nonsense. It is a form of indulgences, which means paying for sin, in this case the sin of habitat destruction. Because solar and wind certainly destroy the habitat they are developed on.

New Study Finds 1970s-Present Antarctic Ice Loss Is ‘Unexceptional’ And Not Due To ‘Climate Change’

by K. Richard, Dec 26, 2024 in NoTricksZone


Ice shelf collapse was much more pronounced and exceptional millennia ago than it has been over the last 47 years.

The advent of post-1970s “climate change” and polar amplification due to the rapidly rising trend in human greenhouse gas emissions was supposed to unleash catastrophic ice calving losses and increases in iceberg size throughout the Earth’s cryosphere.

But a new analysis (MacKie et al., 2024) indicates the size of Antarctic icebergs breaking off from the ice sheet has, contrary to popular assumption, slightly declinedsince 1976. Calving events in recent decades therefore cannot even be conclusively attributed to climate change. Instead, they are representative of what occurs naturally.

“…our results reveal that extreme calving events should not automatically be interpreted as a sign of ice shelf instability, but are instead representative of the natural cycle of calving front advance and retreat.”

Over the last 47 years (1976-2023) calving events peaked during the period from 1986 to 2000. Even so, the largest of the modern icebergs calved from Antarctica’s coastal ice shelves were still four times smaller than what would occur with an exceptional, once-a-century calving event.

New Study: Warming Trend Since 2013 From Increased Absorbed Solar Radiation, Not CO2

by K. Richard, Dec 26, 2024 in ClimateChangeDispatch


The 2013-2022 warming trend and the extreme warmth in 2023 were “not associated with” declining outgoing long-wave radiation induced by rising greenhouse gases. [emphasis, links added]

Instead, a new study published in the journal Science contends that decreasing cloud albedo and the consequent increase in ASR, or absorbed solar radiation (+0.97 to 1.10 W/m²/decade according to ERA5 and CERES, respectively) explains the warming over the last decade. (Less cloud cover means more solar radiation reaches the Earth’s surface, warming it.)

A rising trend in anthropogenic greenhouse gases was supposed to reduce the Earth’s outgoing long-wave radiation (OLR), and a declining OLR was thought to be the driver of modern warming.

Instead, the opposite has occurred. There has been an increasing OLR trend since 2013.

This enhancement of the Earth’s OLR trend actually serves to counteract the ASR-induced warming strongly associated with the aforementioned declining cloud cover albedo.

In other words, the total greenhouse effect impact from rising greenhouse gases has recently been contributing to a reduction in global warming, partially offsetting the warming induced by rising ASR.

Science Shock: CO2 is Good for the Planet, Peer-Reviewed Studies Suggest

by C. Morrison, Dec 24, 2024 in NotaLotof PeopleKnowThat


Dramatic evidence has been published in a number of recent science papers that carbon dioxide levels are already ‘saturated’, meaning little or no further warming is to be expected and rising CO2 levels are all beneficial.

Half of human emissions are being quickly pushed back into the biosphere, the scientists say, causing substantial, famine-busting plant growth, while the rest is entering a ‘saturated’ atmosphere and having a minimal effect on global temperatures. One of the papers accepting the human involvement in rising CO2is published by the CO2 Coalition, which notes: “We like CO2, so should you.”

None of this work will be reported in the mainstream since it disrupts a ‘settled’ climate science narrative tied to the political Net Zero fantasy. But the opinion that humans control the climate thermostat by releasing CO2, leading to runaway temperatures, belongs to a dark period in science when it was captured to promote political aims. However, work continues in sceptical climate circles to understand how a number of gases with warming properties behave in a chaotic, non-linear atmosphere. Two recently-published papers found that doubling CO2 in the atmosphere led to minimal temperature increases. The calculated figures can be considered to be in margin of error territory and on past observational evidence they pose no threat to the climate on Earth. They also destroy the shaky scientific foundation upon which Net Zero rests.

Eight Taiwanese scientists led by Professor Peng-Sheng Wei found that the sensitivity of the climate to a rise in CO2 atmospheric levels from 100 to 400 parts per million (ppm) was “negligibly small” at 0.3°C. The paper is complex and examines heat transfers as a function of longitude, latitude and altitude “as well as diffuse radiation determined by absorption bands based on wavelength, temperature and the concentration or pressure of carbon dioxide vapour”. What the scientists are looking at here is the narrow absorption bands within the infrared (IR) spectrum that allow ‘greenhouse’ gases to trap heat and warm the planet. Many argue that after a certain level the gases ‘saturate’ and lose most of their warming properties. One simple way to understand this is to observe that doubling insulation in a loft will not trap twice as much heat. The saturation hypothesis would appear to explain how CO2 has been 10-15 times higher in the past without runaway temperatures, while the anthropogenic warming opinion does little more than provide scientific cover for a dodgy but fashionable extreme eco scare.

The Intergovernmental Panel on Climate Change claims a climate sensitivity number based on doubling CO2 levels of around 3°C. But many climate models ramp up mass public hysteria by using ‘pathways’ with much larger and highly improbably estimates. The latter form the basis of numerous ‘scientists say’ stories faithfully reported by unquestioning mainstream media. The Taiwanese scientists found that ground temperature warming of 0.3°C was associated with the increase from 100 ppm to 350 ppm and there was no additional warming at all as CO2 rose further from 350 ppm to 400 ppm. The current level of CO2 in the atmosphere is 420 ppm.

A New Study Finds Doubling CO2 Leads To 0.5°C Warming At Most

by K. Richard, Dec 23, 2024 in ClimateChangeDispatch


earth space green

The evidence that rising CO2 concentrations lead to inconsequential warming keeps piling up. [emphasis, links added]

In a new study, seven Viennese researchers provide more evidence the CO2 absorption band is already saturated at today’s concentrations (over 400 ppm).

Rising CO2 levels thus cannot drive significant global warming:

“Data from ground measurements indicate that the downward (backward) radiation of the atmosphere shows indeed full saturation of the IR CO2 bands and does not support noticeable additional Thermal Forcing (TF) by increasing CO2 in the lower atmosphere.”

“…we can expect full saturation already at current concentrations.”

As Table 2 from the study indicates, doubling CO2 from preindustrial levels (280 to 560 ppm) increases global mean infrared absorption by just 1.1% (82.1% vs. 83.2%).

This is an indicator of the decreasing effectiveness of CO2 as a warming agent as its concentration rises.

Indeed, a 400 to 800 ppm increase “shows no measurable increase in the IR absorption for the 15 μ-central peak,” and thus it can lead to just 0.5°C warming at most.

Read more at No Tricks Zone

Ocean Temperatures and Climate Hysteria: A Lesson in Perspective

by C. Rotter, Dec 20, 2024 in WUWT


For the past two years, headlines, policy statements, and social media feeds have been flooded with dire warnings about rising ocean temperatures. Every uptick in the graphs was treated as irrefutable proof of humanity’s march toward ecological collapse. The news cycle offered little room for nuance, and as usual, the loudest voices declared the end was nigh. But a recent tweet from Javier Viños, supported by a graph of global sea surface temperatures (SST), reminds us how quickly climate “emergencies” dissolve when confronted with even the faintest hint of natural variability.

Study Debunks Media’s Iceberg Alarmism: Antarctic Calving ‘Statistically Unexceptional’

by A. Watt,  Dec 20, 2024 in ClimateChangeDispatch


The climate chicken littles of the media blamed it on climate change then, but today, it looks like an Emily Litella moment has just occurred, as a new peer-reviewed scientific study says it wasn’t anything abnormal, nor should we worry about it.

The new study published in Geophysical Research Letters tosses ice-cold water on those overhyped media claims.

In the study, MacKie et al. (2024) analyzed 47 years of observational satellite data from Antarcticaand found that there has been no trend in annual Antarctic maximum calving size between 1976 and 2023.

The key findings of the study are:

  • There has been no detectable upward trend in the annual maximum iceberg area in Antarctica since 1973, based on satellite measurements.
  • The break-off of Iceberg A-68 from the Larsen C Ice Shelf was not statistically notable.
  • Calving events several times larger than anything observed in the modern record could occur, and still, it would not necessarily be due to climate change.

To be clear, the calving of the A-68 iceberg was “statistically unexceptional” in the historical satellite record. Let that sink in. The authors write:

This finding suggests that extreme calving events such as the recent 2017 Larsen C iceberg, A-68, are statistically unexceptional and that extreme calving events are not necessarily a consequence of climate change.

Another Climate Sensitivity Study Finds Doubling CO2 Leads To 0.5°C Warming At Most

by K. Richard, Dec 20, 2024 in NoTricksZone


The evidence that rising CO2 concentrations lead to inconsequential warming keeps piling up.

In a new study, seven Viennese researchers provide more evidence the CO2 absorption band is already saturated at today’s concentrations (over 400 ppm). Rising CO2 levels thus cannot drive significant global warming.

“Data from ground measurements indicate that the downward (backward) radiation of the atmosphere shows indeed full saturation of the IR CO2 bands and does not support noticeable additional Thermal Forcing (TF) by increasing CO2 in the lower atmosphere.”

“…we can expect full saturation already at current concentrations.”

As Table 2 from the study indicates, doubling CO2 from pre-industrial levels (280 to 560 ppm) increases global mean infrared absorption by just 1.1% (82.1% vs. 83.2%). This is an indicator of the decreasing effectiveness of CO2 as a warming agent as its concentration rises.

Indeed, a 400 to 800 ppm increase “shows no measurable increase in the IR absorption for the 15 μ-central peak,” and thus it can lead to just 0.5°C warming at most.

IEA Report: Global Coal Demand To Hit Record High In 2024, Defying Predictions Of Decline

by  R. Bryce , Dec 18, 2024 in ClimateChangeDispatch


The International Energy Agency has been consistent — and consistently wrong — about global coal demand. [emphasis, links added]

In 2015, the Paris-based agency declared, “The golden age of coal in China seems to be over.” That year, it predicted global coal demand would fall to 5.5 billion tons by 2020.

In its 2017 World Energy Outlook, the IEA said, “China remains a towering presence in coal markets, but our projections suggest that coal use peaked in 2013 and is set to decline by almost 15% over the period to 2040.”

In 2020, the agency said, “Looking ahead to 2025, coal demand is expected to flatten.” It continued,

“Unless there are unforeseen developments that significantly boost coal demand in emerging Asian economies and China, it is likely that global coal demand peaked in 2013 at just over 8B tons.”

Wrong. Wrong. And wrong again.

Today, the IEA released its Coal 2024 report, which says global coal use will grow by another 1% this year to an all-time high of 8.77 billion tons.

The agency also reports that:

“coal demand, production, coal-fired generation, and international coal trade will surpass records reached in 2023 to set new all-time records.”

And here’s the key line:

“The power sector has been the main driver of coal demand growth, with electricity generation from coal set to reach an all-time high of 10,700 terawatt-hours (TWh) in 2024.”

Why does this matter? Electricity is the form of energy we crave more than any other. Electricity drives modernity and economic growth.

Primary trade flows in the thermal coal market in 2022 and 2023. Note that most of the arrows point to China and India. Source IEA Coal 2024.

‘No Measurable Effect’: Study Finds ‘Net Zero’ Emissions Would Have Negligible Climate Impact

by K. Richard, Dec 16, 2024 in ClimateChangeDispatch


net zero
Cost-benefit analyses affirm it would be better to abandon Net Zero policy initiatives and instead “do nothing” about greenhouse gas emissions. [emphasis, links added]

New research finds that CO2’s largest possible climate impact is “negligible.”

The cumulative expected temperature change in doubling CO2 from 400 to 800 PPM is only 0.81°C at most, and this is “certainly not cause for alarm or for declaring a climate emergency”.

As Figure 1 from the paper shows [pictured below], the temperature effects of increasing CO2 are strongest when concentrations hover below 100 PPM.

After that, the CO2 impact collapses logarithmically to less than 0.05°C even as concentrations rise to 900 PPM.

Using heat-transfer calculations, it is estimated that even if governments across the world were to actually achieve all of their proposed Net Zero policy goals, it would only elicit a 0.28°C reduction in global temperature.

In other words, it would have “no measurable effect” on climate.

The tens of trillions in costs to achieve an inconsequential global temperature reduction would be much better spent on policies that would improve the economic, health, and educational conditions of those living in poverty.

Climate Models, Clouds, OLR, and ECS

by A. May, Dec 17, 2024 in WUWT


The IPCC and the climate “consensus” believe that essentially all warming since 1750 is due to man’s emissions of CO2 and other greenhouse gases as shown in figure 1 here or in (IPCC, 2021, p. 961). This has led to a 45-year search for the value of the Equilibrium Climate Sensitivity to the doubling of CO2 (“ECS” in °C per 2xCO2). Yet, after spending 45 years trying to calculate the sensitivity of climate to man-made greenhouse gases, the “consensus” has been unable to narrow the uncertainty in their estimates and, if anything, the climate model uncertainty is now larger than in earlier reports(IPCC, 2021, p. 927). It is now clear, at least to me, that modern climate models make many critical assumptions that are poorly supported and sometimes conflict with observations. This is an attempt to explain some of these problems and how they developed over time. It is long past time for the “consensus” to stop ignoring the obvious weaknesses in their 60-year old conceptual model of climate.

The Early Models

Syukuro Manabe built the first general circulation climate model with several colleagues in the 1960s (Manabe & Bryan, 1969) and (Manabe & Wetherald, 1967). He started with a one-dimensional radiative equilibrium model of horizontally averaged temperature but realized that the troposphere was not in radiative equilibrium because of convection. The lower atmosphere is nearly opaque to most surface emitted infrared radiation or Outgoing Longwave Radiation (OLR) because of greenhouse gases. As a result, Earth’s surface is not cooled much by emitting radiation but instead mostly by the evaporation of surface water that carries surface heat into the atmosphere as latent heat inside water vapor. Water vapor is less dense than dry air, so it rises. Once the water vapor is high enough, it cools as the surrounding air pressure drops allowing air parcels to expand, causing the water vapor to condense which releases its latent heat. If this is done at a high enough altitude, some of the latent heat can make it to space as radiation or make it to surrounding greenhouse gas molecules higher in the atmosphere. The rest of the released heat simply warms the neighborhood. This process is called the “moist adiabat.”

No, BBC, Atlantic Hurricane Season Did Not Break Records

by P. Homewood, Dec 1, 2024 in NotaLotofPeopleKnowThat


The 2024 Atlantic hurricane season is coming to an end and it has been an active one overall.

There have been 18 named tropical storms, with 11 of those reaching hurricane strength and five becoming major hurricanes – category three and above.

An average season would bring 14 storms, seven hurricanes and three major hurricanes.

Some records have been equalled or broken but the active weather was not spread evenly across the season. In fact the middle of the season, normally the peak, was very quiet.

https://www.bbc.co.uk/weather/articles/cp87g4p73kxo

.

Despite claims of “records broken”, the BBC makes no mention of what these might be!

Unsurprising, because no records were broken, unless you count Beryl which was claimed to be the earliest Cat 5 on record, which has no significance whatsoever.

Instead, although above average, the number of hurricanes and major ones were not exceptional at all.

Climate Change over the past 4000 Years

by A. May, Dec4, 2024 in WUWT


I last wrote about Climate Change and Civilization for the past 4,000 Years in 2016. Since then, a lot has changed, and I’ve learned a lot more about the subject. First, we learned that various air and sea temperature proxies, such as ice core δ18O or tree rings, are all different. For a discussion of some temperature proxies used and the problems with them, see here. Proxies have different accuracies, they are often sensitive to the temperature of different seasons, and they have different temporal resolutions. Thus, as pointed out by Soon and Baliunas in 2003, they are all local and “cannot be combined into a hemispheric or global quantitative composite.”

The global average surface temperature (GAST) reconstruction relied upon in the IPCC AR6 report was by Kaufman, et al. The authors admit that the average spacing of each temperature (the temporal resolution) is 164 years. Thus, to compare the entire global instrumental temperature record to the proxies in a valid way, one must average all the daily readings since 1860 into one point. That is, the rate of warming since 1860 is irrelevant, the proxy record cannot see a 164-year increase. The problem of comparing daily modern instrumental temperature records to proxies is discussed by Renee Hannon here.

Research: “103 Of 302 Weather Stations In United Kingdom Do Not Exist At All!

by P. Homewood, Nov 27, 2024 in NoTricksZone


Paul Homewood wrote about poorly sited weather stations in Great Britain, thus making readings and climate data rather questionable.

The European Institute for Climate And Energy (EIKE) now reports of Great Britain’s phantom weather station network: one third of all its stations don’t actually exist. 

By Maurice Forgeng. Original article: Epoch Times here.

“All climate forecasts are based on more or less long-term documented measurements from weather stations. They can be used to determine past developments as well as possible trends in future local temperatures. Meteorologists also compile national and international trends based on the data from many measuring stations.”

“But what if much of this basic data is incorrect – or even made up? This is what journalist Ray Sanders claims about the measured values in the UK. According to his research, 103 of the 302 weather measuring stations in the United Kingdom do not exist at all. Nevertheless, they provide official data that is available to everyone on the website of the national weather authority.”

Sanders investigated the weather stations listed by the British Meteorological Service and found discrepancies in the data. For example, the Dungeness weather station supposedly on a nuclear power plant doesn’t exist. In fact, four out of eight stations in Kent do not exist  Also, coordinates for many stations are inaccurate.

Full report at EIKE