Archives de catégorie : to keep an eye on…

Correcting Misinformation on Atmospheric Carbon Dioxide

by Bud Bromley, May 20, 2022 in budbromley


Abstract

Digital signal processing technology was used to analyze daily carbon dioxide data from the joint NOAA – Scripps Oceanographic Institution’s Global Monitoring Laboratory (MLO).  The period surrounding the 1991 eruption of the Pinatubo volcano was rigorously analyzed for slope and acceleration of net global average atmospheric CO2 concentration and found to be consistent with the theory that Henry’s Law, the Law of Mass Action, and Le Chatelier’s principle control net global average atmospheric CO2 concentration rather than human-produced CO2 emissions.  Background and theory are explained.  A method of using common physics and math for a novel purpose is presented to compare natural CO2emission or absorption with human-produced CO2 emission.  The claim that human-produced CO2 emission is causing increasing global CO2 concentration and climate change is shown to be without scientific merit.  

Key words: carbon, CO2, climate, warming, Impulse, Pinatubo, Henry’s Law, Mauna Loa 

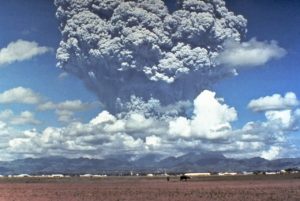
Figure 1. Photo of Pinatubo eruption by Dave Harlowe, USGS. Public domain

Texas winter storm leaves 2M without power amid frigid temperatures

by E. Fordham, Feb 15, 2021 in FoxNews


HISTORIC WINTER STORM SLAMS TEXAS WITH RECORD COLD, ICY ROADS

Rotating power outages were initiated by the Electric Reliability Council of Texas, or ERCOT, early Monday morning, meaning thousands went without electricity for periods of time as temperatures fell into the teens near Dallas and 20s (about minus 5 degrees Celsius) around Houston.

Austin’s electric utility Austin Energy told residents the outages may be longer than usual, prompting angry social media replies from Texans who said they’d been without power for five or more hours.

“Typical events allow short durations of each outage, but outages are longer if the ERCOT grid requires — which is what we’re seeing in today’s event,” Austin Energy wrote on Twitter.

The utility advised residents to keep their keep their thermostat set to 68 degrees or lower, and to avoid using their oven or washing machine. Businesses were likewise advised to minimize operations to conserve energy.

See also : This Blizzard Exposes The Perils Of Attempting To ‘Electrify Everything’

Warmer Than Thought? GWPF Science Editor Sceptical About New Ocean-Warming Paper

by RFI, Jan 12, 2021 in GWPF


A new report published in the US journal Science, led by the Chinese Academy of Sciences, suggests the world’s oceans are warming 40 percent faster than what a UN panel predicted five years ago. Although data collection is more accurate than in the past, some experts advise against jumping to hasty conclusions.

About 93 percent of excess heat trapped around the Earth by greenhouse gases that come from the burning of fossil fuels accumulates in the world’s oceans.

The UN Intergovernmental Panel on Climate Change (IPCC) says ocean warming has led to rising sea levels and contributes to increases in rainfall intensity, more violent storms and the destruction of coral reefs.

It is also a threat to biodiversity and one of the earth’s major food supplies.

“Ocean heating is a very important indicator of climate change, and we have robust evidence that it is warming more rapidly than we thought,” said co-author Zeke Hausfather, a graduate student in the Energy and Resources Group at the University of California, Berkeley.

Their report relied on four studies, published between 2014 and 2017 whose conclusions are based on measurements recorded by a fleet of some 4,000 floating robot monitors called Argo.

The robots drift throughout the world’s oceans, every few days diving to a depth of 2,000 meters and measuring the ocean’s temperature, pH, salinity and other information.

Argo “has provided consistent and widespread data on ocean heat content since the mid-2000s,” the report said.

The new analysis shows warming in the oceans is on pace with measurements of rising air temperature.

And if nothing is done to reduce greenhouse gases, “models predict that the temperature of the top 2,000 meters of the world’s oceans will rise 0.78 degrees Celsius by the end of the century,” it said.

Caution needed when interpreting results

David Whitehouse, the science editor for the Global Warming Policy Forum, based in the UK says we must very careful when drawing conclusions.

Continuer la lecture de Warmer Than Thought? GWPF Science Editor Sceptical About New Ocean-Warming Paper

Solar Winds Hitting Earth Are Hotter Than They Should Be–Here’s Why

by M. McCrae, April 21, 2020 in ClimateChangeDispatch


Our planet is constantly bathed in the winds coming off the blistering sphere at the center of our Solar System.

But even though the Sun itself is so ridiculously hot, once the solar winds reach Earth, they are hotter than they should be – and we might finally know why.

We know that particles making up the plasma of the Sun’s heliosphere cool as they spread out. The problem is that they seem to take their sweet time doing so, dropping in temperature far slower than models predict.

“People have been studying the solar wind since its discovery in 1959, but there are many important properties of this plasma which are still not well understood,” says physicist Stas Boldyrev from the University of Wisconsin–Madison.

“Initially, researchers thought the solar wind has to cool down very rapidly as it expands from the Sun, but satellite measurements show that as it reaches the Earth, its temperature is 10 times larger than expected.”

The research team used laboratory equipment to study moving plasma, and now think the answer to the problem lies in a trapped sea of electrons that just can’t seem to escape the Sun’s grip.

The expansion process itself has long been assumed to be subject to adiabatic laws, a term that simply means heat energy isn’t added or removed from a system.

This keeps the numbers nice and simple but assumes there aren’t places where energy slips in or out of the flow of particles.

Unfortunately, an electron’s journey is anything but simple, shoved around at the mercy of vast magnetic fields like a roller coaster from Hell. This chaos leaves plenty of opportunities for heat to be passed back and forth.

NASA Fights To Keep Debunked 97% Climate-Consensus Claim On Website

by V. Richardson, April 15, 2020 in ClimateChangeDispatch


Nothing sends climate skeptics into orbit faster than seeing NASA repeat the 97% climate-consensus claim, but the effort to have the Obama-era declaration removed from the government website is suffering from a failure to launch.

NASA officials rejected the Competitive Enterprise Institute’s July 9 request for correction under the Information Quality Act, concluding that “changes to the Web site are not needed at this time,” prompting the free-market group to file an appeal Tuesday.

On its Global Climate Change page, NASA states: “Multiple studies published in peer-reviewed scientific journals show that 97 percent or more of actively publishing climate scientists agree: Climate-warming trends over the past century are extremely likely due to human activities.”

CEI attorney Devin Watkins, who called the statement “inaccurate, unreliable, and biased,” said that NASA has refused to budge even though President Trump has expressed reservations about the consensus argument on anthropogenic global warming.

In 2017, for example, Mr. Trump told The Associated that “you have scientists on both sides of the picture.”

“It’s really weird when the President of the United States seems to say the 97% figure is incorrect, but an agency he is responsible for overseeing continues to say on their website that the President is wrong,” Mr. Watkins said in an email.

In her reply to the CEI, NASA chief information officer Renee P. Wynn said that the Global Climate Change website “presents the state of scientific knowledge about climate change and honors the role that NASA has played and plays in researching and communicating climate science.”

Stromatolites on Mars?

by D. Middleton, April 15, 2020 in WUWT


Evidence is steadily mounting that Mars could have supported life in the past and there are tantalizing indications that the Red Planet might still support be microscopic organisms. So, unlike the Face on Mars and impact craters circled up on satellite images, there is reason to believe that geologic features resembling stromatolites, might actually be something like stromatolites… But, we can’t possibly know until astronauts bring Martian sedimentary rocks back home to Earth.

Stromatolites
Lower Proterozic (2.3 billion)
Eastern Andies South of Cochabamba, District of Cochabamba, Bolivia, South America
Fossil Museum Dot Net

Unexpected ice

by N. Vizcarra, February 2020 in EarthData/NASA


Paul Holland, a climate modeler with the British Antarctic Survey, has spent the last ten years studying Antarctica’s sea ice and the Southern Ocean. Lately, he has been scrutinizing the seasons of Antarctica and how fast the ice comes and goes. Holland thinks these seasons may be a key to a conundrum: If Earth’s temperatures are getting warmer and sea ice in the Arctic has been shrinking fast, why then is sea ice in the Antarctic slowly increasing?

Spring surprise

Holland used data from NASA’s National Snow and Ice Data Center Distributed Active Archive Center (NSIDC DAAC) to calculate the ice concentration rate of growth for each single day, which he called intensification; and the total ice area rate of growth, which he called expansion. “I did that for all thirty years of data and plotted the trends,” he said. Holland’s plots showed that the different regions in the Southern Ocean contributed to the overall increase, but they had very diverse trends in sea ice growth. This suggested that geography and different wind patterns played a role. So to gain more insight Holland looked at seasonal wind trends for the different regions.

Holland found that winds were spreading sea ice out in some regions and compressing or keeping it intact in others and that these effects began in the spring. It contradicted a previous study in which, using ice drift data, Holland and Ron Kwok from the NASA’s Jet Propulsion Laboratory (JPL) found that increasing northward winds during the autumn caused the variations.

“I always thought, and as far as I can tell everyone else thought, that the biggest changes must be in autumn,” Holland said. “But the big result for me now is we need to look at spring. The trend is bigger in the autumn, but it seems to be created in spring.”

“Paul has created two more sea ice metrics that we can use to assess how Antarctic sea ice is responding,” said researcher Sharon Stammerjohn, referring to the measures of intensification and expansion. The new metrics help assess how the system is responding as opposed to simply monitoring the state of the system. “Say your temperature is at 99.2 degrees Fahrenheit,” Stammerjohn said. “You don’t have any insight to that temperature unless you take it again an hour later and you see that it changed to 101 degrees. Then you can say, okay, my system is responding to something.”

8000 Years Of Zero Correlation Between CO2 And Temperature, GISP 2 Ice Core Shows – Opposite Is True!

by P. Gosselin, December 20, 2019 in NoTricksZone


A plot of ice core data from Greenland reveals that CO2 does not drive temperatures.

At Facebook, Gregory Wrightstone posted a chart plotting atmospheric CO2 concentration reconstructed from  Dome C Ice Core versus temperature that was reconstructed from the GISP 2 Ice Core.

According to global warming scientists, there’s supposed to be tandem movement between the two magnitudes.

CO2, they say, drives global temperature.

But over the past 8000 years, the data show that temperature in reality has moved in the opposite direction of CO2 and thus of what climate alarmist scientists have told us.


If anything can be drawn from the plotted data, it is that there’s an inverse correlation: As CO2 rises, temperature drops. But of course there’s a lot more to it. CO2 is not that huge major climate driver that alarmists like having us believe it is.

Recent Scientific Work on Climate

by D. Siegel, December 199, 2019 in MediumWork


In this piece, I’m going to summarize some of the more recent work by scientists and statisticians on climate. It’s important to understand that …

The List Grows – Now 100+ Scientific Papers Assert CO2 Has A Minuscule Effect On The Climate

by K. Richard, December 12, 2019 in NoTricksZone


Within the last few years, over 50 papers have been added to our compilation of scientific studies that find the climate’s sensitivity to doubled CO2 (280 ppm to 560 ppm) ranges from <0 to 1°C. When no quantification is provided, words like “negligible” are used to describe CO2’s effect on the climate. The list has now reached 106 scientific papers.

Link: 100+ Scientific Papers – Low CO2 Climate Sensitivity

A few of the papers published in 2019 are provided below:

Scientists Found the Deepest Land on Earth Hiding Beneath Antarctica’s Ice

by Rafi Letzter, December 13, 2019 in LiveScience


A new mapping effort revealed critical new details of Antarctica’s hidden land.

A new map of the mountains, valleys and canyons hidden under Antarctica‘s ice has revealed the deepest land on Earth, and will help forecast future ice loss.

The frozen southern continent can look pretty flat and featureless from above. But beneath the ice pack that’s accumulated over the eons, there’s an ancient continent, as textured as any other. And that texture turns out to be very important for predicting how and when ice will flow and which regions of ice are most vulnerable in a warming world. The new NASA map, called BedMachine Antarctica, mixes ice movement measurements, seismic measurements, radar and other data points to create the most detailed picture yet of Antarctica’s hidden features.

Related: 50 Amazing Facts About Antarctica

“Using BedMachine to zoom into particular sectors of Antarctica, you find essential details, such as bumps and hollows beneath the ice that may accelerate, slow down or even stop the retreat of glaciers,” Mathieu Morlighem, an Earth system scientist at the University of California, Irvine and the lead author of a new paper about the map, said in a statement.

The new map, published Dec. 12 in the journal Nature Geoscience, reveals previously unknown topographical features that shape ice flow on the frozen continent.

The previously unknown features have “major implications for glacier response to climate change,” the authors wrote. “For example, glaciers flowing across the Transantarctic Mountains are protected by broad, stabilizing ridges.”

Scientists: Climate Records ‘Correlate Well’ With Solar Modulation…A Grand Solar Minimum Expected By 2030

by K. Richard, November 11, 2019 in NoTricksZone


International and NASA solar scientists find their Total Solar Irradiance reconstruction extending to 1700 can “correlate well” with Earth’s global temperature records, including a positive net TSI trend during 1986-2008. A new Grand Solar Minimum is expected to commence during the 2030s.

Surface climate records that have been uncorrupted by coastal (ocean-air)/urbanization biases suggest there has been a long-term oscillation in temperature since 1900, with peaks during the 1920s-1940s and again during recent decades (Lansner and Pepke Pedersen, 2018).

Doomsday poll shrinks 25%: Now just 11,000 MeToo scientists say “panic now”

by JoNova, November 2019


Who remembers that 15,000 scientists signed some climate declaration in 2017? The same Prof Ripple, and Bioscience probably hope you don’t, because two years later there is the same rehashed, but with only 11,000 signatories. So 4,000 disappeared without a trace. There are however, the same comic indefendable graphs. Call it “extreme graphing” — every line needs to be diagonal. All “pauses” are disappearing. No fallacy remains unbroken.

To stop storms we apparently need to reduce the global population, stop mining “excessive” minerals, eat more veges,  and we need to preserve biodiversity, reefs, forests and greenery at whatever it was in 1685 or whenever the sacred preindustrial year of Life On Earth is declared. You know the drill — coal and oil are demon spirits. Exorcise them now! Then rinse, repeat and …hand-wash your undies.

After crowing about how unqualified skeptics were, only 156 (1%) of the 11,000 have the word “climate” in their job title or specialty. And even these climate experts mostly seem to be experts in adapting or mitigating climate change. They know things about food, forests, ecology, land use, disease, law, agriculture, policy, economics, communication and tree survival. This is not to say that they are wrong because of their qualifications (they’re wrong because of the arguments they make), but isn’t it rather odd, that the real experts in the field of climate modeling are all missing? Could it be that these 11,000 scientists are the me-too propaganda arm endorsing graphs and arguments that real modelers can’t afford to?

Also here and  here

Oscillations of the baseline of solar magnetic field and solar irradiance on a millennial timescale

by Zharkova V. V. et al., June  24, 2019 in Nature OPEN ACCESS


Abstract

Recently discovered long-term oscillations of the solar background magnetic field associated with double dynamo waves generated in inner and outer layers of the Sun indicate that the solar activity is heading in the next three decades (2019–2055) to a Modern grand minimum similar to Maunder one. On the other hand, a reconstruction of solar total irradiance suggests that since the Maunder minimum there is an increase in the cycle-averaged total solar irradiance (TSI) by a value of about 1–1.5 Wm−2 closely correlated with an increase of the baseline (average) terrestrial temperature. In order to understand these two opposite trends, we calculated the double dynamo summary curve of magnetic field variations backward one hundred thousand years allowing us to confirm strong oscillations of solar activity in regular (11 year) and recently reported grand (350–400 year) solar cycles caused by actions of the double solar dynamo. In addition, oscillations of the baseline (zero-line) of magnetic field with a period of 1950 ± 95 years (a super-grand cycle) are discovered by applying a running averaging filter to suppress large-scale oscillations of 11 year cycles. Latest minimum of the baseline oscillations is found to coincide with the grand solar minimum (the Maunder minimum) occurred before the current super-grand cycle start. Since then the baseline magnitude became slowly increasing towards its maximum at 2600 to be followed by its decrease and minimum at ~3700. These oscillations of the baseline solar magnetic field are found associated with a long-term solar inertial motion about the barycenter of the solar system and closely linked to an increase of solar irradiance and terrestrial temperature in the past two centuries. This trend is anticipated to continue in the next six centuries that can lead to a further natural increase of the terrestrial temperature by more than 2.5 °C by 2600.

Climategate: Ten Years Later

by Dr K. Kemm, November 1, 2019 in ClimateChangeDispatch


This month marks the tenth anniversary of “Climategate” – the release of thousands of emails to and from climate scientists who had been (and still are) collaborating and colluding to create a man-made climate crisis that exists in their minds and computer models, but not in the real world.

The scandal should have ended climate catastrophism.

Instead, it was studiously buried by politicians, scientists, activists and crony capitalists, who will rake in trillions of dollarsfrom the exaggerations and fakery, while exempting themselves from the damage they are inflicting on everyday families.

Few people know the Inconvenient Facts about the supposed man-made climate and extreme weather “crisis.”

For example, since 1998, average global temperatures have risen by a mere few hundredths of a degree. (For a time, they even declined slightly.)

Yet all we hear is baseless rhetoric about man-made carbon dioxide causing global warming and climate changes that pose existential threats to humanity, wildlife, and the planet.

Based on this, we are told we must stop using fossil fuels to power economic growth and better living standards. This is bad news for Africa and the world.

We keep hearing that rising atmospheric carbon dioxide levels cause rising global temperatures.

But satellite data show no such thing. In fact, computer model predictions for 2019 are almost a half-degree Celsius (0.9 degrees F) above actual satellite measurements.

See also here

COLDEST OCTOBER 6 EVER RECORDED IN THE NETHERLANDS — ADDITIONAL ARCTIC AIR ON THE WAY FOR EUROPE

by Cap Allon, October 7, 2019 in Electroverse


Bone chilling cold descended into Europe over the weekend, exactly as forecast by the GFS. And the ‘Polar Invasion’ will continue to seize practically ALL of the continent throughout the week, sinking temps as much as 20C below average, with only far Western regions spared.

This past Sunday went down as the coldest October 6th ever recorded in ALL of Holland, in record books dating back to 1901 (solar minimum of cycle 13).

The country’s daily high, measured at the national weather station in De Bilt, climbed to just 9.6C (49F), which busted the previous record low of 10.1C (50F) set back in 1936 (just exiting solar min of cycle 16).

The weekend’s chill was thanks to a descending Arctic air mass which brought icy easterly winds, thick cloud cover and heavy rain. This pattern will run for rest of the week, and is expected to see further record lows temps tumble.

While across Europe the story is the same, too — all-time cold records will likely tumble in Central, Southern and Eastern parts, particularly during the first half of the week, with Italy, the Ukraine, Romania, Greece, Hungary, Slovakia, Austria and southern Poland on course to be worst hit:

55 New (2019) Scientific Papers Link Solar Activity To Climate Change

by K. Richard, October 3, 2019 in NoTricksZone


In the last few years, hundreds of peer-reviewed scientific papers have been published linking changes in solar activity to Earth’s climate (2016, 2017, 2018). The evidence for a robust Sun-Climate connection continues to accumulate in 2019.

When it comes to the Sun’s influence on climate, one conclusion is certain: there is no widespread scientific agreement as to how and to what extent solar activity and its related parameters (i.e., galactic cosmic rays, geomagnetic activity, solar wind flux) impact changes in the Earth’s temperature and precipitation.

The disagreement is so chasmic and the mechanisms are so poorly understood that scientists’ estimates of the influence of direct solar irradiance forcing between the 17th century and today can range between a negligible +0.1 W m-2 to a very robust +6 W m-2 (Egorova et al., 2018Mazzarella and Scafetta, 2018).

There is no consensus on the amplitude of the historical solar forcingThe estimated magnitude of the total solar irradiance difference between Maunder minimum and present time ranges from 0.1 to 6 W/m2 making uncertain the simulation of the past and future climate.”  (Egorova et al., 2018)
“According to the IPCC (2013), solar forcing is extremely small and cannot induce the estimated 1.0–1.5 °C since the LIA. However, thesolar radiative forcing is quite uncertain because from 1700 to 2000 the proposed historical total solar irradiance reconstructions vary greatly from a minimum of 0.5 W/m2 to a maximum of about 6 W/m2 (cf..: Hoyt and Schatten 1993; Wang et al. 2005; Shapiro et al. 2011). Moreover, it is believed that the sun can influence the climate also via a magnetically induced cosmic ray flux modulation (e.g.: Kirkby 2007) or via heliospheric oscillation related to planetary resonances (e.g.: Scafetta 2013, 2014b; Scafetta et al. 2016, and others). Since solar and climate records correlate quite significantly throughout the Holocene (cf: Kerr 2001; Steinhilber et al. 2012; Scafetta 2012, 20104b), the results shown herein may be quite realistic, although the exact physical mechanisms linking astronomical forcings to climate change are still poorly understood.”  (Mazzarella and Scafetta, 2018)”

Eocene Climatic Optima: Another Clean Kill of Carbon Dioxide-Driven Climate Change Hypothesis?

by David Middleton, September 30, 2019 in WUWT


Key points

  1. The Eocene was, on average, 4–15 °C warmer than today.
  2. Atmospheric CO2 was very likely in the 450-600 ppm range.
  3. Modern climate models would require 4,500 ppm CO2 to simulate the Eocene temperature range;
  4. And/or a climate sensitivity of 4-8 °C per doubling;
  5. And/or “that other climate forcings were stronger than previously assumed”.

They totally missed the most obvious reason why just about every effort to gin up a paleo example of CO2-driven climate change falls apart: Atmospheric CO2 is not a primary driver of climate change over geologic time. This wouldn’t mean that it isn’t a greenhouse gas or that it has no effect on temperature. It would simply mean that it was a relatively minor climate driver, like volcanic eruptions.

At some point over the past 30 years or so, the assumption that CO2 drives modern climate change has become a paradigm. And I think we have seen a rare failure in the application of the geologic principle of Uniformitarianism.

Uniformitarianism is often incorrectly cited as the reason geologists were slow to accept plate tectonics, the impact theory of the K-Pg extinction and why the hypotheses for a Younger Dryas impact and abiotic oil are generally unaccepted. However, Uniformitarianism may be why a CO2-driven climate paradigm appears to have come into wide acceptance, at least in academia.

Figure 3a. Marine pCO2 (foram boron δ11B, alkenone δ13C), atmospheric CO2 from plant stomata (green and yellow diamonds with red outlines), Mauna Loa instrumental CO2 (thick red line) and Cenozoic temperature change from benthic foram δ18O (light gray line).


Protesting Warmth? Greta’s Home, Sweden, Is 3°C COLDER Today Than Nearly All Of The Last 9000 Years

by K. Richard, September 26, 2019 in NoTricksZone


Greta Thunberg lives in Sweden. According to peer-reviewed science, Sweden was at least 3°C warmer than it is today about 6000 to 9000 years ago, when CO2 concentrations lingered around 265 ppm. At 410 ppm CO2, 21st century Sweden is colder now than almost any time in the last 9000 years.

A Much Warmer Northern Hemisphere

During the Medieval Warm Period, wine vineyards flourished in Scandinavia and Russia at the same latitude (55°N) where polar bears roam today.

German Climatologist Werner Kirstein Unloads: “IPCC Is To Deceive People”…Calls Michael Mann’s Chart “A Fake”

by P. Gosselin, Sep.17, 2019  in NoTricksZone


German climate scientist Professor Werner Kirstein was interviewed by alternative media outlet NuoViso,  and since the video was released early this month on Youtube, it has been viewed over 130,000, times.

Politics commissioning reports for money

In the interview Professor Kirstein tells moderator Robert Stein that CO2 emissions have no effect on the climate and that “politicians commission climate scientists to produce expert reports for money.”

“Public is being deceived”

Prof. Kirstein talks about the “conscious deception” of the public and how all research projects and publications by “climate scientists” only have the goal of confirming “man-made climate change” and that different scientific views are not welcome.

According to Kirstein, the public is being deceived with the false information and that the aim of politics is to find a way to collect further taxes and to collect levies.

“We currently see this with the climate tax, which is to be introduced soon,” Kirstein says.

Ruan et al., 2019   

A Skeptic’s Guide To Global Temperatures

by Clive Best, August 30, 2019 in ClimateChangeDispatch


Climate change may well turn out to be a benign problem rather than the severe problem or “emergency” it is claimed to be.

This will eventually depend on just how much the Earth’s climate is warming due to our transient but relatively large increase in atmospheric CO2 levels.

This is why it is so important to accurately and impartially measure the Earth’s average temperature rise since 1850. It turns out that such a measurement is neither straightforward, independent, nor easy.

For some climate scientists, there sometimes appears to be a slight temptation to exaggerate recent warming,  perhaps because their careers and status improve the higher temperatures rise.

NASA: We Can’t Model Clouds, So Climate Model Projections Are 100x Less Accurate

by K. Richard, August 30, 2019 in ClimateChangeDispatch


NASA has conceded that climate models lack the precision required to make climate projections due to the inability to accurately model clouds.

Clouds have the capacity to dramatically influence climate changes in both radiative longwave (the “greenhouse effect”) and shortwave.

Cloud cover domination in longwave radiation

In the longwave, clouds thoroughly dwarf the CO2 climate influence. According to Wong and Minnett (2018):

  • The signal in incoming longwave is 200 W/m² for clouds over the course of hours. The signal amounts to 3.7 W/m² for doubled CO2 (560 ppm) after hundreds of years.

  • At the ocean surface, clouds generate a radiative signal 8 times greater than tripled CO2 (1120 ppm).

  • The absorbed surface radiation for clouds is ~9 W/m². It’s only 0.5 W/m² for tripled CO2 (1120 ppm).

  • CO2 can only have an effect on the first 0.01 mm of the ocean. Cloud longwave forcing penetrates 9 times deeper, about 0.09 mm.


Climate Scientists Admit Their Models Are Wrong

by Bud Bromley, August 30, 2019 in PrincipiaScientificInternational


Climate scientists who support human-caused global warming, for example Ben Santer and Michael Mann, authored a peer reviewed paper which acknowledges that their climate models are wrong, although their admission is buried in weasel words and technical jargon:

In the scientific method it is not the obligation or responsibility of skeptics or “deniers” to falsify or disprove hypotheses and theories proposed by climate scientists.  It is the obligation and responsibility of climate scientists to present evidence and to defend their hypothesis.  Alarmist climate scientists have failed to do so despite the expense of billions of dollars of taxpayer money.

https://www.nature.com/ngeo/journal/vaop/ncurrent/full/ngeo2973.html

http://climatechangedispatch.com/the-pause-in-global-warming-is-real-admits-climategate-scientist/

Read more at budbromley.blog

How the Media Help to Destroy Rational Climate Debate

by Dr Roy Spencer, August 25, 2019 in GlobalWarming


An old mantra of the news business is, “if it bleeds, it leads”. If someone was murdered, it is news. That virtually no one gets murdered is not news. That, by itself, should tell you that the mainstream media cannot be relied upon as an unbiased source of climate change information.

There are lots of self-proclaimed climate experts now. They don’t need a degree in physics or atmospheric science. For credentials, they only need to care and tell others they care. They believe the Earth is being murdered by humans and want the media to spread the word.

Most people do not have the time or educational background to understand the global warming debate, and so defer to the consensus of experts on the subject. The trouble is that no one ever says exactly what the experts agree upon.

When you dig into the details, what the experts agree upon in their official pronouncements is rather unremarkable. The Earth has warmed a little since the 1950s, a date chosen because before that humans had not produced enough CO2 to really matter. Not enough warming for most people to actually feel, but enough for thermometers to pick up the signal buried in the noise of natural weather swings of many tens of degrees and spurious warming from urbanization effects. The UN consensus is that most of that warming is probably due to increasing atmospheric CO2 from fossil fuel use (but we really don’t know for sure).

For now, I tend to agree with this consensus.

And still I am widely considered a climate denier.

Why? Because I am not willing to exaggerate and make claims that cannot be supported by data.

The widely reported Greenland surface melt event around 1 August 2019 (green oval) was then followed by a recovery to normal in the following weeks (purple oval), which was not reported by the media.

Amazon Fire History Since 2003

by Les Johnson, August 23, 2019 in WUWT


We are told that Amazon fires are at record levels right now. This is a blatant lie. The only “record” is that Amazonian fires have DECREASED over the “record”.

This (is) what the data actually looks like, to August 22. Yes, its updated daily.

This comes from a wonderful site, https://www.globalfiredata.org/forecast.html#elbeni

It uses NASA MODIS data, from the Terra and Aqua satellites, and is updated daily. By going to the website, you can look at individual regions in the Amazon, or as I have done, look at the totals for the Amazon. This site also has global data, but I am only looking at the Amazon region here.

The Interactive Graphs are very informative. Hovering the cursor over the graph will show the data at that point.

You can highlight individual years, by clicking on a year in the legend at the bottom of the graph. That year remains bright, while the rest are dimmed. Using Eyeball Mark 1 Trend Indicator (EBM1TI), 2019 is slightly high, but not at record levels. Not even close.

One thing I saw by looking at each year, was a rough pattern – one or two bad years, one or two years at much lower levels, then a bad year. This pattern is there until 2010. 2010 was the last “bad year”. Levels since 2010 have been 1/2 or less of the “bad years”. The old pattern has been broken.


See also here