by P. Voosen, Oct 10, 2024 in Science
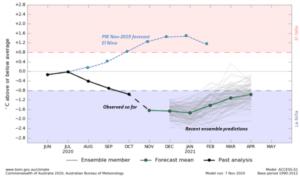
For the past year, alarm bells have been going off in climate science: Last year’s average global temperature was so high, shooting up nearly 0.3°C above the previous year to set a new record, that human-driven global warming and natural short-term climate swings seemingly couldn’t explain it. Some, like famed climate scientist James Hansen, suggestedEarth is entering an ominous new phase of accelerated warming, driven by a rapid decline in sunlight-dimming air pollution. Others, like Gavin Schmidt, director of NASA’s Goddard Institute for Space Studies, said the rise might represent a “knowledge gap,” some new climate feedback that might tip the planet toward a future even warmer than models predict.
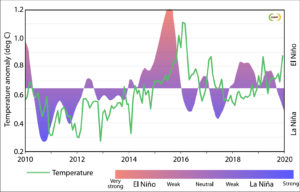
Now, a new series of studies suggests most of the 2023 jump can be explained instead by a familiar climate driver: the shifting waters of the tropical Pacific Ocean. The combination of a 3-year-long La Niña, which suppressed global temperatures from 2020 to 2022, followed by a strong El Niño could account for the unexpected temperature jump, the work suggests. “Earth can do this,” says Shiv Priyam Raghuraman, a climate scientist at the University of Illinois Urbana-Champaign, who led one study.
During La Niña, strong trade winds push warm surface water west along the equator toward Indonesia and pull up a fountain of deep, cold water in the eastern Pacific that helps cool the planet. During El Niño, the winds collapse, allowing warm water to slosh east and shut off the ocean air conditioner. Continuer la lecture de El Niño fingered as likely culprit in record 2023 temperatures →


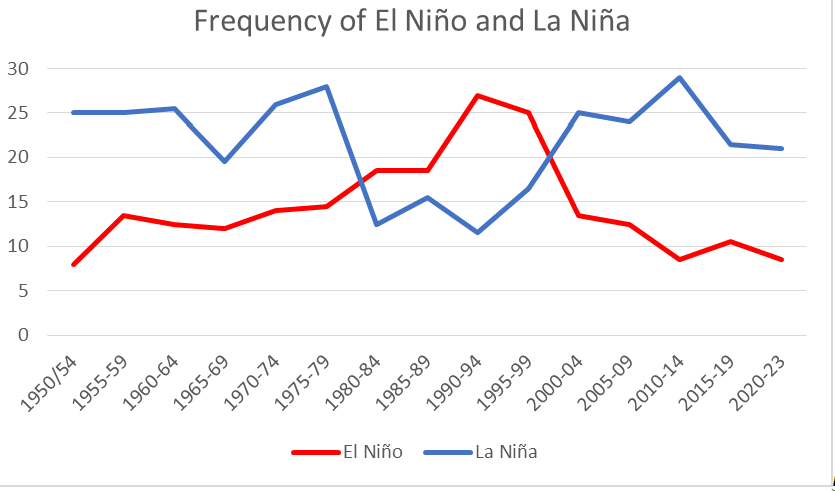
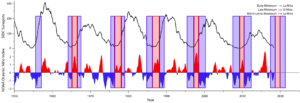
 Figure 1: UAH global temperature anomaly

