by K. Richard, July 14 2025, in NoTricksZone
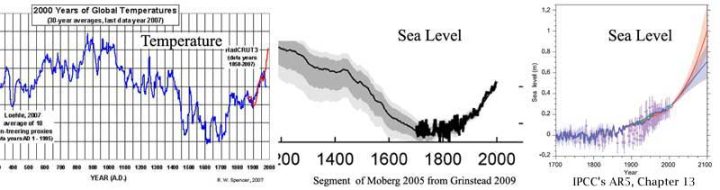
The narrative that says relative sea level changes are driven by variations in atmospheric CO2 concentrations has taken another hit.
Before relative sea level (RSL) declined to its present position over the last millennium, Africa’s Atlantic coast RSL ranged anywhere from 0.8 to 4 meters higher than today between 5000 and 1700 years ago (Vacchi et al., 2025).
This Mid- to Late-Holocene RSL highstand was “mainly controlled by the deglaciation history” − meltwater contributions from Earth’s ice sheets and glaciers. Because the climate was so much warmer than today at that time, there was significantly less water locked up on land as ice.
The Antarctic Thermal Optimum “simulated melt of the western Antarctic ice sheet until 2.0 ka BP.” Consequently, sea levels were still ≥ 1 meter higher than present during the Roman Warm Period
“Between -15°N and -0°…data indicate RSL reached its maximal elevation above the present sea level in the late Holocene (~2.0 to ~1.7 ka BP).”
…