P. Gosselin, Apr, 10, 2025 in ClimateChangeDispatch

We hear it again and again: the melting ice in Greenland due to global warming will soon lead to a collapse of the Gulf Stream system, with the result that it would be difficult to restart. [emphasis, links added]
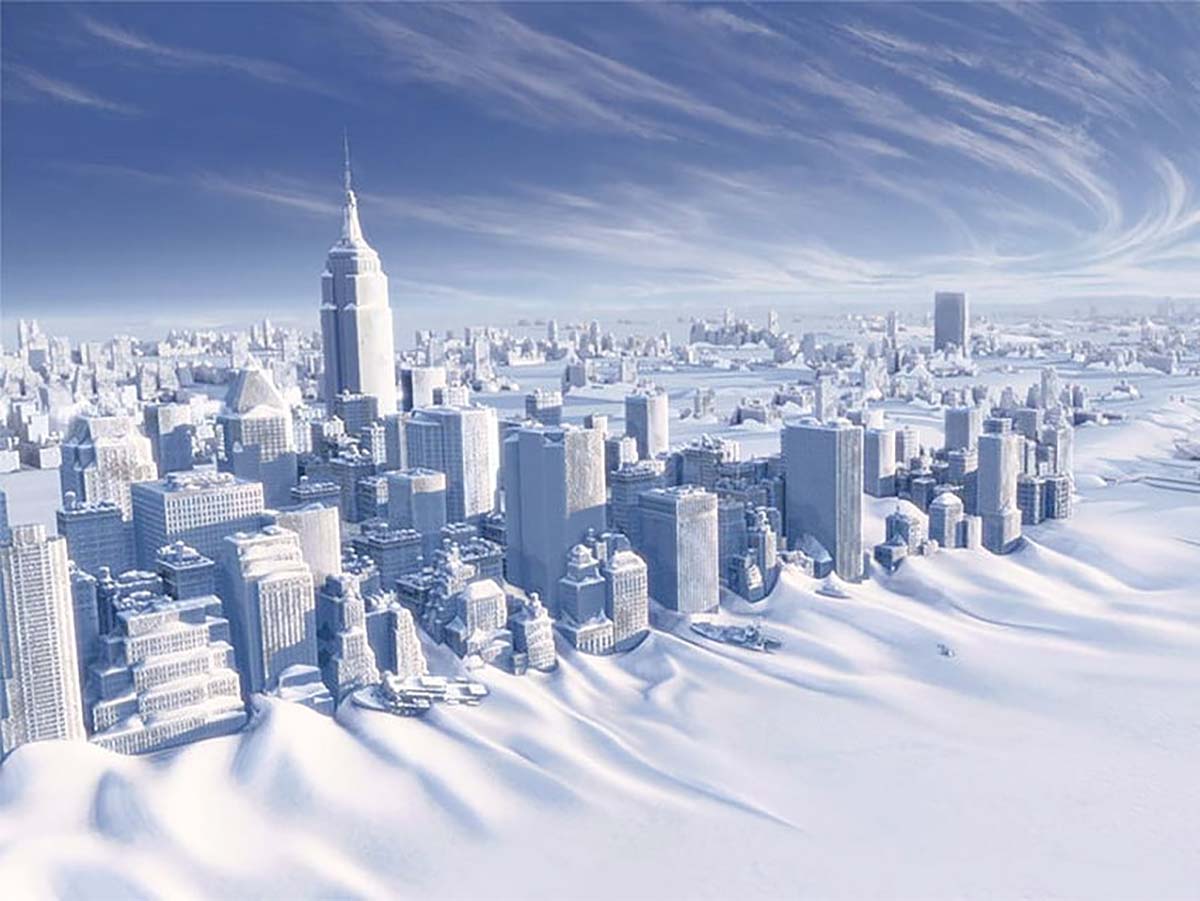
Then we would see great disasters like those depicted in Roland Emmerich’s dramatic climate movie “The Day after Tomorrow”.
The seawater salinity in the north is critical because the salt-rich tropical water cools and sinks due to the higher salt content.
This acts as the pump that makes circulation possible in the first place. It serves to transport very large amounts of heat into the North Atlantic, keeping Europe on the mild side in the wintertime.
Scenarios have been published recently that calculate a drastic cooling of the large area (especially Europe) around it if the Gulf Stream system got “switched off”.
But those scenarios are proving to be overdramatic and alarmist.
Yuxin Zhou, a postdoctoral researcher in UC Santa Barbara’s Department of Earth Science, recently went back in history to study when the AMOC was severely weakened, from 68,000 to 16,000 years ago, when the Laurentide Ice Sheet existed and thick ice covered northern North America and even New York City.
Today, that massive ice shelf no longer exists and thus there is no longer the potential of an ice melt and iceberg release of that scale.
Very different, less dramatic circumstances today
By analyzing sea sediment deposited by floating icebergs in the North Atlantic, Zhou found that the AMOC heat-transferring oceanic current had already been moderately weakened before all the icebergs floated over the North Atlantic.
Comparing the situation to today, Zhou says, “In contrast, the circulation is very vigorous right now,” which suggests the melting of Greenland is not likely to plunge the North Atlantic into another deep freeze of the sort the alarmists fret about all the time.
Moreover, Technology Networks here adds (emphasis added):
Not all melting has the same effect on the Atlantic circulation. Freshwater released as icebergs has a much larger impact on the AMOC than runoff, which is released after melting on land. Icebergs can cool the surrounding seawater, causing it to freeze into sea ice. Ironically, this ice layer acts as a blanket, keeping the ocean surface warm and preventing it from plunging down to the depths and driving the Atlantic circulation. What’s more, icebergs travel much farther out to sea than runoff, delivering freshwater to the regions where this deepwater formation occurs.”
…