by Thomas Frederikse, 2018 in AMS
Different sea level reconstructions show a spread in sea level rise over the last six decades and it is not yet certain whether the sum of contributors explains the reconstructed rise (…)

by Thomas Frederikse, 2018 in AMS
Different sea level reconstructions show a spread in sea level rise over the last six decades and it is not yet certain whether the sum of contributors explains the reconstructed rise (…)
by Larry Hamlin, February 13, 2018 in WUWT
The record snowfalls of 2018 that are sweeping across the Northern Hemisphere and continuing the growth trend in winter snowfall levels provide yet more compelling evidence that the UN IPCC AR5 WG1 climate report and models are flawed because this report concludes that future snowfall level trends will only decline.(…)
by Julian Lee, February 11, 2018 in BloombergGadlfy
The latest surge in U.S. oil output will probably hasten the country’s rise to the top of the producer pile. More important, it’s starting to look as though at least half of OPEC’s nightmare scenario for 2018 — a surge in shale output and slowdown in demand growth — is coming true.
Last week’s avalanche of releases from the U.S. Department of Energy showed daily oil production above 10 million barrels a day for the first time since 1970.
by Dr S. Crockford, February 12, 2018 in ClimateChangeDispatch
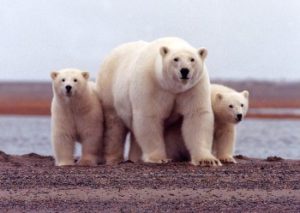
It acknowledges that polar bear numbers have not declined in recent years even though summer sea ice dropped dramatically but goes on to perpetuate a number of myths that might not have happened if the author had done his homework or quizzed his other experts as thoroughly as he did me.
by A. Watts, February 12, 2018 in WUWT
Arctic Weather Brrrrreaking Records
Rankin Inlet, Nunavut gets cold in the winter. Located on the northwestern shore of the Hudson Bay at 62 degrees north and between Chesterfield Inlet and Arviat, the town is definitely in a remote yet exposed region. Weather is just a part of life and recently the weather has been colder than cold.
by Terri Cook, February 9, 2018, In WUWT A. Watts
Medieval Temperature Trends in Africa and Arabia
A synthesis of paleotemperature reconstructions from published case studies suggests warm onshore temperatures persisted across most of Afro-Arabia between 1000 and 1200 CE. (…)
Preliminary Conclusions:
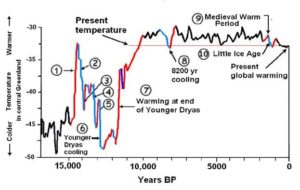
1. During the first 2000 years of our 5000-year civilization, most of the time, the annual average temperature was 2ºC higher than now. The temperature in January was 3-5ºC higher than now.
2. From then on, there was a series of temperature fluctuations. The lowest temperatures occurred in AD 1000, 400, 1200, and 1700. The range of fluctuation was 1-2ºC.
3. In every 400-800 period, a smaller cycle lasting 50 to 100 years can be detected with a temperature range of 0.5 -1ºC.
4. During the above cycles, it seems that any coldest period started from the Pacific coast of East Asia. The cold waves then moved westward to Europe and the Atlantic coasts. And at the same time, there were also trends from the North to the South.
by A. Watts, February 9, 2018, in WUWT
Surprise! Poster child for sea level rise, Tuvalu, is actually growing!
From the “we told you so, again, and again” department. We’ve had several articles about the island of Tuvalu and the ridiculous claims of sea level rise causing it to disappear, while at the same time they are building new hotels and airports to attract tourists. Willis has also had several articles on how Pacific atolls grow, and float, rather than sink as sea level advances.
Now, a study confirms what we’ve already known – atolls, and in particular Tuvalu is growing, and increasing land area. So much for climate alarmism. From Nature communications:
by J.A. Marusek, February 2018, in WUWT
The sun is the natural source of heat and light for our planet. Without our sun, the earth would be a cold dead planet adrift in space. But the sun is not constant. It changes and these subtle changes affect the Earth’s climate and weather.
At the end of solar cycle 23, sunspot activity declined to a level not seen since the year 1913. [Comparing Yearly Mean Total Sunspot Numbers1]
The following was observed during the solar cycle 24: (…)
by P Homewood, February 10, 2018 in NotaLotofPeopleKnowThat
As mentioned yesterday, scientists now believe we could be heading into a 50 year period of reduced solar activity similar to what happened in the mid-17th century, which could lead to a drop in global temperatures of “several tenths of a degree Celsius”.
As has been pointed out, climate is a far more complex matter than climate scientists admit, and one about which we still know very little.
Whether a Maunder-like Minimum will happen again in the next few years, and whether it will have the effect claimed, remain to be seen.
But there is considerable evidence that the Maunder Minimum did coincide with a sharp fall in temperatures across the NH, as NASA show above.
See also here
by A. Watts, February 4, 2018 in WUWT
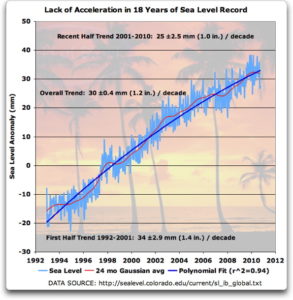
We’ve been told over an over again that global warming would melt the icecaps, and melt Greenland, and that would result in catastrophic sea level rise flooding cities. We’ve also been told that “sea level rise is “accelerating” but in an investigation done here on WUWT by Willis Eschenbach, Putting the Brakes on Acceleration, he noted in 2011 that there seems to be no evidence of it at all, and notes that sea level was rising faster in the first half of the record.
by Nic Lewis, February 5, 2018 in ClimateAudit
Recently a new model-based paper on climate sensitivity was published by Kate Marvel, Gavin Schmidt (the head of NASA GISS) and others, titled ‘Internal variability and disequilibrium confound estimates of climate sensitivity from observations’. It appears to me that the novel part of its analysis is faulty, and that the part which isn’t faulty isn’t novel.
by P. Gosselin, February 2, 2018 in NoTricksZone
Over the past months a spate of scientific papers published show sea level rise has not accelerated like many climate warming scientists warned earlier. The reality is that the rise is far slower than expected, read here and here
(…)
by Sheldon Walker, February 3, 2018 in WUWT
I recently read an article by Tamino aka Grant Foster of Portland, ME, called “Global Warming: the Relentless Trend“.
Many of the points that he made annoyed me, and I started to write an article to document his many errors. Half way through the article, I suddenly realised that some of the issues that skeptics and warmists argue about, like slowdowns and pauses, are caused by the terminology, and the definitions of the words that we use.
So that you can enjoy how I was going to trash Tamino’s article, I will leave in the half of the article that I had already written, before I had my revelation.
by C.E. Manchego et al., December 21, 2017 in PLOS_One
Using presence-only modeling and native forest masks from the Ecuadorian Ministry of Environment, we obtained approximations of characteristic tree species distributions in the dry deciduous forest of southwestern Ecuador, which are threatened by deforestation and climate change. Our estimates indicate that deforestation affects more spatial range than climate change, even under an extreme climate change scenario. Despite this result, climate change may cause additional stress at the species and community levels
by U. of Kansas, February 2, 2018 in WUWT, A. Watts
On a ho-hum day some 12,800 years ago, the Earth had emerged from another ice age. Things were warming up, and the glaciers had retreated.
Out of nowhere, the sky was lit with fireballs. This was followed by shock waves.
Fires rushed across the landscape, and dust clogged the sky, cutting off the sunlight. As the climate rapidly cooled, plants died, food sources were snuffed out, and the glaciers advanced again. Ocean currents shifted, setting the climate into a colder, almost “ice age” state that lasted an additional thousand years.
Finally, the climate began to warm again, and people again emerged into a world with fewer large animals and a human culture in North America that left behind completely different kinds of spear points.
by M. Chase, February 2, 2018 in WUWT
This article describes a simple but effective procedure for regional average temperature reconstruction, a procedure that you, yes you dear reader, can fully understand and, if you have some elementary programming skills, can implement.
To aid readability, and to avoid the risk of getting it wrong, no attempt is made in the article to give proper attribution to previous work of others, but a link is provided at the end to where a list of references can be found.
(…)
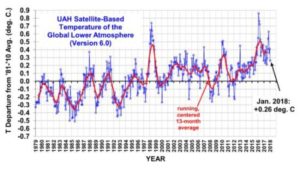
by Roy W. Spencer, February 1st, 2018, in GlobalWarmnig
Coolest tropics since June, 2012 at -0.12 deg. C.
The Version 6.0 global average lower tropospheric temperature (LT) anomaly for January, 2018 was +0.26 deg. C, down from the December, 2017 value of +0.41 deg. C
by A. Watts, January 31, 2018 in WUWT
After several decades of extremely dry weather, residents in southern regions of Morocco finally woke up this morning to an unusual snowfall that currently impacted Ouarzazate, Taroudant and even Zagora, which has not experienced snowfall for fifty years.
Several photos and videos have been posted on social media depicting the cities covered with a huge layer of snow. Despite the freezing cold temperatures, many residents went outside to enjoy the unexpected snowfall.
by A Watts, September 10, 2009 in WUWT
UPDATED: This opinion piece from Professor Henrik Svensmark was published September 9th in the Danish newspaper Jyllands-Posten. Originally the translation was from Google translation with some post translation cleanup of jumbled words or phrases by myself. Now as of Sept 12, the translation is by Nigel Calder. Hat tip to Carsten Arnholm of Norway for bringing this to my attention and especially for translation facilitation by Ágúst H Bjarnason – Anthony
(…)
by Patti Domm, January 31, 2018 in CBNC
- U.S. crude oil production broke 10 million barrels a day in November for the first time since production peaked in 1970, at the start of a decades long decline.
- The U.S. is the world’s third largest oil producer, and its status is growing. Russia is the largest, with about 11 million barrels a day. The U.S. output rivals Saudi Arabia, which has had production of 10.6 million barrels a day, but currently has cut back due to the OPEC deal with Russia and others to keep supply off the market.
- The U.S. production is expected to expand and could top 12 million barrels a day by the end of 2019, according to Dan Yergin, IHS Markit Vice Chairman.
by Ron Clutz, January 31, 2018 inClimateChangeDispatch
The question could be paraphrased in these words: Why are there differences between various graphs that report changes in global temperatures?
The short answer is: The differences arise both from what is measured and how the measurements are processed. (…)
by P Gosselin, January 31, 2018 in NoTricksZone
Dr. Sebastian Lüning and Prof. Fritz Vahrenholt today here are asking how sea level rise is doing because as have not heard much about it lately. A good place to start is at Climate4You. Strangely the data go only until December 2016. And if you look at the data from the source form the University of Colorado, we find the same. So what’s with 2017?
(…)
by Donald et al. 2017, in CO2Science from Géochim.Cosmochim.Acta
The influence of pHsw on both pHcf and the calcification rate of Neogoniolithon is plotted in Figure 1 below. As indicated there, this coralline algal species is able to elevate its pHcf so as to increase its rate of calcification under moderate levels of ocean acidification (pHsw of 7.91 and 8.05), which increase the authors say is “most likely due to CO2-fertilization of [algal] photosynthesis” that is limited in Neogoniolithon at these lower pCO2 conditions. (….)
by Haaretz and Reuters, January 29, 2018
Surging shale production is poised to continue pushing U.S. oil output to more than 10 million barrels per day – toppling a record set in 1970 and crossing a threshold few could have imagined even a decade ago. The U.S. government forecasts that the nation’s production will climb to 11 million barrels a day by late 2019, a level that would rival Russia, the world’s top producer.
(…)
New technology, new fields
The next phase of shale output growth depends on techniques to squeeze more oil from each well. Companies are now putting sensors on drill bits to more precisely access oil deposits, using artificial intelligence and remote operators to get the most out of equipment and trained engineers.