Full-time professor at the Free University of Brussels, Belgium
apreat@gmail.com
apreat@ulb.ac.be
• Department of Earth Sciences and Environment
Res. Grp. - Biogeochemistry & Modeling of the Earth System
Sedimentology & Basin Analysis
• Alumnus, Collège des Alumni, Académie Royale de Sciences, des Lettres et des Beaux Arts de Belgique (mars 2013). http://www.academieroyale.be/cgi?usr=2a8crwkksq&lg=fr&pag=858&rec=0&frm=0&par=aybabtu&id=4471&flux=8365323
• Prof. Invited, Université de Mons-Hainaut (2010-present-day)
• Prof. Coordinator and invited to the Royal Academy of Sciences of Belgium (Belgian College) (2009-
present day)
• Prof. partim to the DEA (third cycle) led by the University of Lille (9 universities from 1999 to 2004) - Prof. partim at the University of Paris-Sud/Orsay, European-Socrates Agreement (1995-1998)
• Prof. partim at the University of Louvain, Convention ULB-UCL (1993-2000)
• Since 2015 : Member of Comité éditorial de la Revue Géologie de la France http://geolfrance.brgm.fr
• Since 2014 : Regular author of texts for ‘la Revue Science et Pseudosciences’ http://www.pseudo-sciences.org/
• Many field works (several weeks to 2 months) (Meso- and Paleozoic carbonates, Paleo- to Neoproterozoic carbonates) in Europe, USA (Nevada), Papouasia (Holocene), North Africa (Algeria, Morrocco, Tunisia), West Africa (Gabon, DRC, Congo-Brazzaville, South Africa, Angola), Iraq... Recently : field works (3 to 5 weeks) Congo- Brazzaville 2012, 2015, 2016 (carbonate Neoproterozoic).
Degree in geological sciences at the Free University of Brussels (ULB) in 1974, I went to Algeria for two years teaching mining geology at the University of Constantine. Back in Belgium I worked for two years as an expert for the EEC (European Commission), first on the prospecting of Pb and Zn in carbonate environments, then the uranium exploration in Belgium. Then Assistant at ULB, Department of Geology I got the degree of Doctor of Sciences (Geology) in 1985. My thesis, devoted to the study of the Devonian carbonate sedimentology of northern France and southern Belgium, comprised a significant portion of field work whose interpretation and synthesis conducted to the establishment of model of carbonate platforms and ramps with reefal constructions.
I then worked for Petrofina SA and shared a little more than two years in Angola as Director of the Research Laboratory of this oil company. The lab included 22 people (micropaleontology, sedimentology, petrophysics). My main activity was to interpret facies reservoirs from drillings in the Cretaceous, sometimes in the Tertiary. I carried out many studies for oil companies operating in this country.
I returned to the ULB in 1988 as First Assistant and was appointed Professor in 1990. I carried out various missions for mining companies in Belgium and oil companies abroad and continued research, particularly through projects of the Scientific Research National Funds (FNRS).
My research still concerns sedimentology, geochemistry and diagenesis of carbonate rocks which leads me to travel many countries in Europe or outside Europe, North Africa, Papua New Guinea and the USA, to conduct field missions.
Since the late 90's, I expanded my field of research in addressing the problem of mass extinctions of organisms from the Upper Devonian series across Euramerica (from North America to Poland) and I also specialized in microbiological and geochemical analyses of ancient carbonate series developing a sustained collaboration with biologists of my university. We are at the origin of a paleoecological model based on the presence of iron-bacterial microfossils, which led me to travel many countries in Europe and North Africa. This model accounts for the red pigmentation of many marble and ornamental stones used in the world. This research also has implications on the emergence of Life from the earliest stages of formation of Earth, as well as in the field of exobiology or extraterrestrial life ...
More recently I invested in the study from the Precambrian series of Gabon and Congo. These works with colleagues from BRGM (Orléans) are as much about the academic side (consequences of the appearance of oxygen in the Paleoproterozoic and study of Neoproterozoic glaciations) that the potential applications in reservoir rocks and source rocks of oil (in collaboration with oil companies).
Finally I recently established a close collaboration with the Royal Institute of Natural Sciences of Belgium to study the susceptibility magnetic signal from various European Paleozoic series. All these works allowed me to gain a thorough understanding of carbonate rocks (petrology, micropaleontology, geobiology, geochemistry, sequence stratigraphy, diagenesis) as well in Precambrian (2.2 Ga and 0.6 Ga), Paleozoic (from Silurian to Carboniferous) and Mesozoic (Jurassic and Cretaceous) rocks. Recently (2010) I have established a collaboration with Iraqi Kurdistan as part of a government program to boost scientific research in this country.
My research led me to publish about 180 papers in international and national journals and presented more than 170 conference papers. I am a holder of eight courses at the ULB (5 mandatory and 3 optional), excursions and field stages, I taught at the third cycle in several French universities and led or co-managed a score of 20 Doctoral (PhD) and Post-doctoral theses and has been the promotor of more than 50 Masters theses.
The discovery pushed back the time for the emergence of microbial life on land by 580 million years and also bolstered a paradigm-shifting hypothesis laid out by UC Santa Cruz astrobiologists David Deamer and Bruce Damer: that life began, not in the sea, but on land.
The Permian geologic period that ended the Paleozoic era climaxed around 252 million years ago with a sweeping global mass extinction event in which 90 to 95 percent of marine life became extinct. It would take 30 million years for planetary biodiversity to recover. Understanding the contributing factors of the end-Permian mass extinction is critical to understanding and perhaps mitigating the current anthropogenic climate change.
The discovery by researchers from Imperial could lead to a range of improvements including advances in Carbon Capture and Storage (CCS). This is where industrial emissions will be captured by CCS technology, before reaching the atmosphere, and safely stored in rock deep underground.
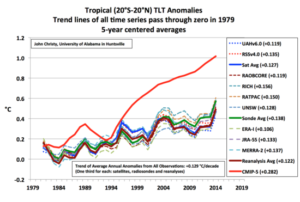
It’s pretty clear that the models are producing too much atmospheric warming compared to satellites, radiosondes (weather balloons), and multi-observational atmospheric reanalyses.
The conclusive findings of this research are that the three GAST data sets are not a valid representation of reality. In fact, the magnitude of their historical data adjustments, that removed their cyclical temperature patterns, are totally inconsistent with published and credible U.S. and other temperature data. Thus, it is impossible to conclude from the three published GAST data sets that recent years have been the warmest ever –despite current claims of record setting warming.
There are two main groups that use essentially the same NASA and NOAA satellites to estimate global temperatures. In the last year, they’ve both made adjustments, one down, and one up, getting further apart in their estimates. In ClimateWorld this is a big deal. Believers are excited that now a satellite set agrees a bit better with the maligned “hot” surface thermometers. But UAH still agrees more with millions of weather balloons. The debate continues. Here’s my short synopsis of the Roy Spencer (and John Christy) from the “Comments on the new RSS lower tropospheric temperature set.” (If something is wrong here, blame me).
In understanding climate change risk, and deciding on the ‘if’ and ‘what’ of ‘action’, we need to acknowledge that we don’t know how the climate of the 21st century will play out (Deep Uncertainty, folks). Four possibilities:
It is possible that human-caused climate change will be swamped by much larger natural climate variability.
It is possible/plausible that the sensitivity of the climate is on the low end of the IPCC envelope (1.0-1.5C), with a slow creep of warming superimposed on much larger natural variability.
It is possible/plausible that the IPCC projections are actually correct (right for the wrong reasons; too much wrong with the climate models for much credibility, IMO).
It is possible that AGW and natural variability could conspire to cause catastrophic outcomes
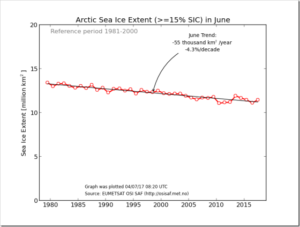
The graphic shows the mean September sea ice extent on the northern hemisphere. The plotted values correspond approximately to the sea ice area that ‘survived’ the summer melt in the respective years
The graph illustrates a decreasing trend in sea ice extent since 1978, with annual variations of occationally more than 1 million square kilometres. The 2012 sea ice minimum extented set a new minimum record.
In our attempt to better understand the nature of our planet’s abrupt climate changes I have already reviewed the glacial-interglacial cycle, and the Dansgaard-Oeschger cycle’s that take place during glacial periods. I now start reviewing the millennial climate cycles that abruptly impact the slowly changing Holocene climate. The most significant and regular one is the ~ 2400-year Bray cycle.
After 30 years of failure to gain support of the US public for massive public policy measures to fight climate change, climate activists now double down on the tactics that have failed them for so long. This post explains why it will not work. Nor should it. Instead they should trust the IPCC and science, showing both the good and bad news.
Few things illustrate the poor state of the communication of climate science better than the reaction to Environmental Protection Agency Administrator Scott Pruitt’s comments about global temperatures in the past 20 years. It was made in written comments to the Senate following his confirmation hearing. He wrote, “over the past two decades satellite data indicates there has been a leveling off of warming.” Has the temperature increase of the Earth’s surface and lower atmosphere “stalled” in the past 20 years or so? Does this change our view of climate change?
Yes, Arctic sea ice has declined since satellite records began in 1979 but polar bears have adjusted well to this change, especially to the abrupt decline to low summer sea ice levels that have been the norm since 2007. Some polar bear subpopulations have indeed spent more time on land in summer than in previous decades but this had little negative impact on health or survival and while polar bear attacks on humans appear to have increased in recent years (Wilder et al. 2017), the reasons for this are not clear: reduced summer sea ice is almost certainly not the causal factor (see previous post here).
Large, robust, lens-shaped microfossils from the approximately 3.4 billion-year-old Kromberg Formation of the Kaapvaal Craton in eastern South Africa are not only among the oldest elaborate microorganisms known, but are also related to other intricate microfossils of the same age found in the Pilbara Craton of Australia, according to an international team of scientists.
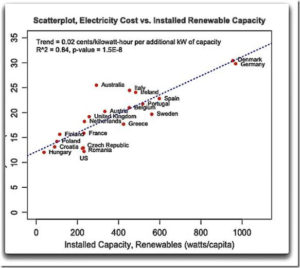
The level of renewable use is now so high in Germany that serious electric grid reliability and stability issues now exist which require both fossil power plant emergency backup for failed renewable production and dictate rejecting renewable energy to ensure operation of fossil plants required for electric grid reliability and stability.
Over at Dr. Curry’s excellent website, she’s discussing the Red and Blue Team approach. If I ran the zoo and could re-examine the climate question, I’d want to look at what I see as the central misunderstanding in the current theory of climate.
This is the mistaken idea that changes in global temperature are a linear function of changes in the top-of-atmosphere (TOA) radiation balance (usually called “forcing”).
I thought I’d take a moment from my R&R to write about all the hullabaloo surrounding the calving of the large iceberg off the Larsen C ice shelf in Antarctica. First, a few of the headlines:
On Wednesday, Premier Oil Plc, Sierra Oil & Gas and Talos Energy LLC announced the first Mexican discovery by explorers other than state-owned Pemex in 80 years, a reservoir with an estimated 1.4 billion to 2 billion barrels
Progressive bottom melting and break-up of West Antarctica’s seafloor hugging Larsen Ice Shelf is fueled by heat and heated fluid flow from numerous very active geological features, and not climate change.
A new opinion poll of 10,000 European citizens reveals majority of Europeans reject the claim that climate change is mainly or entirely caused by humans.
For the last few decades, questions about the causes and impacts of climate change have dominated the climate debate. The IPCC and many climate scientists have been claiming relentlessly that the global warming trend since the second half of the 20th century is mainly if not entirely man-made, i.e. as a result of anthropogenic greenhouse gas emissions. This dogma is habitually claimed to be the global climate consensus.
When considering the scale of temperature changes that alarmists anticipate because of Man-made Global Warming and their view of the disastrous effects of additional Man-made Carbon Dioxide emissions in this century, it is useful to look at climate change from a longer term, century by century and even on a millennial perspective.
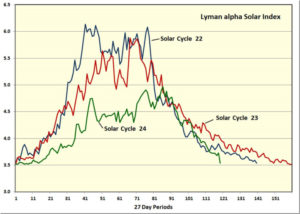
This recent post was on the fact that the Sun’s EUV emissions had fallen to solar minimum-like levels well ahead of solar minimum. The implication was that the Solar Cycle 24/25 minimum was either going to be very deep and prolonged, or that Solar Cycle 24 would be very short, which in turn would be strange for a weak cycle.
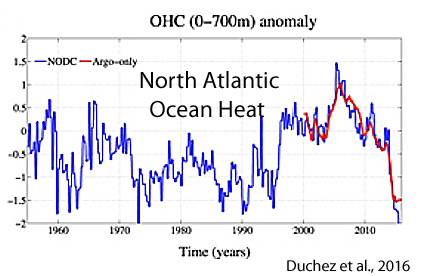
It’s official. According to a new paper published in the journal Scientific Reports,Greenland has been cooling slightly since 2005.
This trend development may be a harbinger of what may be in store for the coming years. Shifts in North Atlantic temperatures typically lead changes in the Arctic by a few years. And throughout the North Atlantic, rapid cooling has been underway since 2005, plunging below the levels reached in the 1950s
Global energy investment fell by 12% in 2016, the second consecutive year of decline, as increased spending on energy efficiency and electricity networks was more than offset by a continued drop in upstream oil and gas spending, according to the International Energy Agency’s annual World Energy Investmentreport.
Global energy investment amounted to USD 1.7 trillion in 2016, or 2.2% of global GDP. For the first time, spending on the electricity sector around the world exceeded the combined spending on oil, gas and coal supply. The share of clean-energy spending reached 43% of total supply investment, a record high.
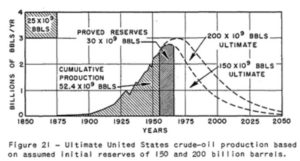
Hubbert’s fame in peak oil circles comes primarily from the assertion that he accurately predicted the 1970 U.S. peak. Because of this prediction, Hubbert is widely-regarded among peak oil adherents as a visionary. He has been called an oracle and a prophet. A recently published article — What Hubbert And Pickens Got Right About Oil, And What’s Next — recounts the uncanny accuracy of his prediction.
Source: Nuclear Energy and the Fossil Fuels by M. King Hubbert
La géologie, une science plus que passionnante … et diverse
