by P Homewood, February 10, 2018 in NotaLotofPeopleKnowThat
As mentioned yesterday, scientists now believe we could be heading into a 50 year period of reduced solar activity similar to what happened in the mid-17th century, which could lead to a drop in global temperatures of “several tenths of a degree Celsius”.
As has been pointed out, climate is a far more complex matter than climate scientists admit, and one about which we still know very little.
Whether a Maunder-like Minimum will happen again in the next few years, and whether it will have the effect claimed, remain to be seen.
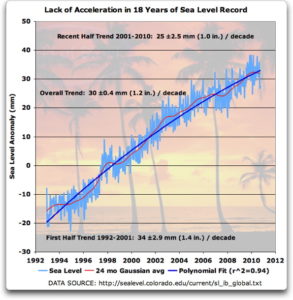
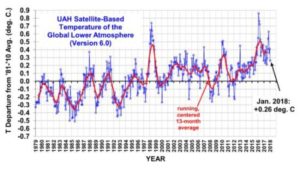
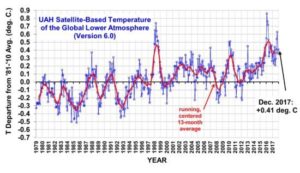
But there is considerable evidence that the Maunder Minimum did coincide with a sharp fall in temperatures across the NH, as NASA show above.
See also here