by Ron Clutz, January 12, 2010 in ClimateChangeDispatch
The Pomeroy essay focuses on theories in the field of psychology and describes stages through which they rise, become accepted, challenged and discarded.
It has long seemed to me that global warming/climate change theory properly belongs in the field of social studies and thus should demonstrate a similar cycle.
Summary: Here are brief excerpts and my comments from a speech by an eminent climate scientist. It illuminates important aspects about one of the great public policy debates of our time. He was speaking candidly to his peers, but we can also learn much from it.
“Some Thoughts from a Reluctant Participant”
Presentation by Richard Alley.
At the Forum on Transforming Communication in the Weather, Water, and Climate Enterprise — Focusing on Challenges Facing Our Sciences.
Given at the 2018 Annual Conference of the American Meteorological Society, 7 January 2018.
by Tony Heller, January 11, 2018 in TheDeplorableClimSciBlog
Afternoon temperatures during the first week of January have been declining in the US for a century, and have dropped more than ten degrees during the last decade.
Princeton University researchers have found that the climate models scientists use to project future conditions on our planet underestimate the cooling effect that clouds have on a daily — and even hourly — basis, particularly over land.
The researchers report in the journal Nature Communications Dec. 22 that models tend to factor in too much of the sun’s daily heat, which results in warmer, drier conditions than might actually occur. The researchers found that inaccuracies in accounting for the diurnal, or daily, cloud cycle did not seem to invalidate climate projections, but they did increase the margin of error for a crucial tool scientists use to understand how climate change will affect us.
SPOTLIGHT: We’re told that the Intergovernmental Panel on Climate Change (IPCC) is a scientific organization that makes scientific determinations. But that isn’t true.
Prologue: I have been writing recently about Sea Level Rise, both as particular local examples ( Guam, Canton, Miami, New York, and NY/NJ ) and in the series SEA LEVEL: Rise and Fall, of which this is the fourth installment.
Series Take Home Messages:
Overall, the seas have been rising, slowly and inexorably, since the end of the last Ice Age, with some blips and bumps along the way. In general, they will continue to do so for the foreseeable future — at somewhere between 4-12 inches [10-30cm] per century. This rate is an imminent threat to populated areas built nominally at today’s existing sea level.
Science is hard. Some easy problems you can solve by hard work, if you are in the right place at the right time and have the right skills. Hard problems take the combined effort of multiple groups looking at the problem, publishing results and finding fault with eachother’s work, until hopefully no-one can find any more problems. When problems are hard, you may have to publish something that even you don’t think is right, but that might advance the discussion.
The calculation of an unbiased sea surface temperature record is a hard problem. Historical sea surface temperature observations come from a variety of sources, with early records being measured using wooden, canvas or rubber buckets (figure 1), later readings being taken from engine room intakes or hull sensors, and the most recent data coming from drifting buoys and from satellites.
A new study published Jan. 8 in the journal Nature Geoscience reveals that strong El Nino events can cause significant ice loss in some Antarctic ice shelves while the opposite may occur during strong La Nina events.
by Paul Homewood, January 8, 2018 in NotaLotofPeopleKnowThat
The England & Wales Precipitation Series has now been updated for last year.
Precipitation totalled 952mm during the year, slightly above the series average of 918mm. In ascending order, 2017 ranked 158th.
There seems to be little evidence of any real trends. Whatever trend can be winkled out of the numbers will likely be too small to notice, and swamped by the natural variability in the data.
The wettest years remain 1872 and 1768. The driest were 1788 and 1921.
Short summary: scientists sought political relevance and allowed policy makers to put a big thumb on the scale of the scientific assessment of the attribution of climate change.
Climate Myths: We keep reading about how the extreme weather of 2017 is the “new normal” thanks to global warming — even if the weather in question is frigid air. But the data don’t show any trend in extreme weather events in the U.S. for decades. Science, anyone?
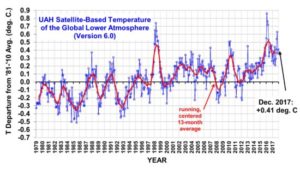
2017 Third Warmest in the 39-Year Satellite Record
Global Satellite Monitoring of Temperature Enters its 40th Year
The Version 6.0 global average lower tropospheric temperature (LT) anomaly for December, 2017 was +0.41 deg. C, up a little from the November, 2017 value of +0.36 deg. C
These 485 new papers affirm the position that there are significant limitations and uncertainties inherent in our understanding of climate and climate changes, emphasizing that climate science is not settled.
by M Bastach, January 5, 2017 in ClimateChangeDispatch
Record snowfall, a “bomb cyclone” and cold Arctic air have once again stirred up the debate over global warming’s impact on winter weather.
Some climate scientists are pointing the finger at manmade global warming as a culprit behind recent wintry weather, but there’s not a lot of evidence or agreement that global warming is currently driving extreme cold and snow (…)
Contrary to expectations, climate scientists continue to report that large regions of the Earth have not been warming in recent decades.
According to Dieng et al. (2017), for example, the global oceans underwent a slowdown, a pause, or even a slight cooling trend during 2003 to 2013. This undermines expectations from climate models which presume the increase in radiative forcing from human CO2 emissions should substantially increase ocean temperatures.
The authors indicate that the recent trends in ocean temperatures “may just reflect a 60-year natural cycle“, the AMO (Atlantic Multidecadal Oscillation), and not follow radiative forcing trends.
Global Temperature Report: December 2017 Global climate trend since Nov. 16, 1978: +0.13 C per decade December temperatures (preliminary)
Global composite temp.: +0.41 C (about 0.74 degrees Fahrenheit) above 30-year average for December.
Northern Hemisphere: +0.50 C (about 0.90 degrees Fahrenheit) above 30-year average for December.
Southern Hemisphere: +0.33 C (about 0.59 degrees Fahrenheit) above 30-year average for December.
Tropics: +0.26 C (about 0.47 degrees Fahrenheit) above 30-year average for November.
Other countries are failing to meet their targets, but we’re not only achieving them, we’re overdoing it. And this is despite our obvious handicaps: like that we have rapid population growth, are further from everywhere and anywhere* except for Antarctica, and we’re the largest coal exporter in the world;
The indefatigable Roy Spencer at the University of Alabama at Huntsville is the first to declare the global temperature anomaly for December 2017. As Fig. 1 shows, in the 39 years 1 month from December 1978 to December 2017, the planet has warmed by half a Celsius degree. But that is equivalent to 1.28 C°/century, or little more than one-third of the 3.3 C°/century predicted with “substantial confidence” by IPCC in 1990 and also by the fifth-generation general-circulation models of the Climate Model Intercomparison Project in 2013.
Determining magnitudes of sea surface temperature variability is important for attributing past and predicting future changes in climate, and generally requires the use of proxies to constrain multidecadal and longer timescales of variability. We report a multiproxy estimate of sea surface temperature variability that is consistent between proxy types and with instrumental estimates but strongly diverges from climate model simulations toward longer timescales. At millennial timescales, model−data discrepancies reach two orders of magnitude in the tropics, indicating substantial problems with models or proxies, or both, and highlighting a need to better determine the variability of sea surface temperatures.
In the last 12 months, 150 graphs from 122 peer-reviewed scientific papers have been published that undermine the popularized conception of a slowly cooling Earth temperature history followed by a dramatic hockey-stick-shaped uptick, or an especially unusual global-scale warming during modern times.
Yes, some regions of the Earth have been warming in recent decades or at some point in the last 100 years.
Some regions have been cooling for decades at a time.
And many regions have shown no significant net changes or trends in either direction relative to the last few hundred to thousands of years.
Succinctly, then, scientists publishing in peer-reviewed journals have increasingly affirmed that there is nothing historically unprecedented or remarkable about today’s climate when viewed in the context of long-term natural variability.
The following (partial) list has been organized by geographical region
The East Antarctic Ice Sheet locks away enough water to raise sea level an estimated 53 meters (174 feet), more than any other ice sheet on the planet. It’s also thought to be among the most stable, not gaining or losing mass even as ice sheets in West Antarctica and Greenland shrink.
Meteorologist Joe Bastardi warned of a cold snap gripping the Eastern US many weeks ago, in October, at his Weatherbell Analytics site, which I visit almost daily.
Today it’s all over the news: The Great Freeze of 2017 is smashing through the entire North American East, bringing with it a wave of record temperatures.
I got to thinking about the records of the sea level height taken at tidal stations all over the planet. The main problem with these tide stations is that they measure the height of the sea surface versus the height of some object attached to the land … but the land isn’t sitting still. In most places around the planet the land surface is actually rising or falling, and in some places, it’s doing so at a surprising rate, millimeters per year.
Tales of doom and gloom about polar bears reflect what some people think might happen in the future, not what is happening right now. Currently, polar bears are doing just fine despite the low summer sea ice coverage they’ve experienced since 2007 (Crockford 2017a; York et al. 2016). In other words, there has been no global population decline as predicted: officially, the numbers were 22,000-31,000 (or 26,500 average) in 2015 (Wiig et al. 2015) but about 28,500 when estimates published since then are included (Aars et al. 2017; Dyck et al. 2017; Matishov et al. 2014; SWG 2016), up from about 22,500 in 2005).
La géologie, une science plus que passionnante … et diverse