(…) What does this all mean? Are models consistent with observations or not? Up to the recent very large El Nino, it seemed that even climate scientists were on the verge of conceding that models were running too hot, but the El Nino has given them a reprieve. After the very large 1998 El Nino, there was about 15 years of apparent “pause”. Will there be a similar pattern after the very large 2017 El Nino?
We are witnessing a holy alliance between Third World ecologists and big finance, orchestrated by the European Union, under the amused gaze of the American giant who has now taken leave of all this masquerade.
Sometimes you have to wonder which are the biggest fraud: Germany’s claim that its cars are clean, or its claim of being a leader in climate protection. Both, it turns out, are very fake and even downright frauds.
While German Chancellor Angela Merkel and German activists like going around and scolding Donald Trump for his “irresponsible” stance on “greenhouse” gas emissions, it is coming to light that Germany’s climate posturing is indeed a total swindle.
A new paper by renowned Swedish sea level expert Prof. Axel Mörmer published in the International Journal of Earth & Environmental Sciences dumps lots of cold water on the premise that today’s sea level rise is caused by man and is unusual.
Mörner’s paper looks back at the last 500 years of sea level rise and shows that natural variables are the major drivers, and not man-made CO2-driven global warming.
This is quite interesting. Remember the claim in on the front cover of Nature in 2009 by Steig and Mann that Antarctica was warming, thanks to that “special Mannian PCA math sauce” that was applied to air temperature data to smear surface temperature trends over the entire continent? It was dashed by climate skeptics who wrote a paper. It was accepted for publication and disproved (in my opinion) by a team of credible skeptics that wrote a counter-paper. But, there’s an interesting twist thanks to new and surprising data; Steig and Mann may have captured surface air temperature trends in the exact same areas that have been identified as geothermal hot spots.
While the effects of climate change on tree growth in forests have been extensively studied, there is little information available so far for urban trees”, said Professor Hans Pretzsch from the Chair for Forest Growth and Yield Science at TUM. The study supported by the Bavarian State Ministry for Environment and Consumer Protection as well as by the Audi Foundation for the Environment, which was published in the journal Scientific Reports, for the first time systematically examined the growth of urban trees worldwide for trends resulting from changing environmental conditions.
(…)The body of evidence however clearly shows that the climate sensitivity is on the low side, about 1 to 1.5 degree increase per CO2 doubling. People in the climate community are scratching their heads trying to understand the so called hiatus in the warming. Where is the heat hiding? While in reality it simply points to a low sensitivity.
It is far too early to judge this year’s global temperature developments and their significance regarding the long-term warming trend.
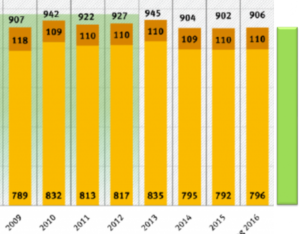
The United Nations climate change conference, held in Bonn this year, is always the cue for press releases from the World Meteorological Office and the UK Met Office in which they give their assessment of the year based on 9-10 months of data.
Dealing with the El Nino of recent years (and don’t forget the ‘Pacific Blob’ before that) they have had difficulty with explaining what part of the record temperature was due to El Nino and natural, and what was anthropogenic.
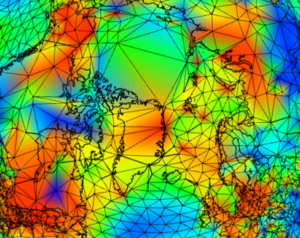
The plots attached here are taken from the MOYHU blog maintained by Nick Stokes here. The software on the blog allows the global temperature anomaly data for each month for the last several years, it also allows the mesh showing the temperature measurement points to be turned on and off.
by Freeman Dyson, November 10, 2017 in WUWTFREEMAN DYSON is professor of physics at the Institute for Advanced Study, in Princeton. His professional interests are in mathematics and astronomy
My first heresy says that all the fuss about global warming is grossly exaggerated. Here I am opposing the holy brotherhood of climate model experts and the crowd of deluded citizens who believe the numbers predicted by the computer models. Of course, they say, I have no degree in meteorology and I am therefore not qualified to speak.
But I have studied the climate models and I know what they can do.
In addition, we consider temperature dependent natural emission and absorption rates, by which the paleoclimatic CO2 variations and the actual CO2 growth rate can well be explained. The anthropogenic contribution to the actual CO2concentration is found to be 4.3%, its fraction to the CO2 increase over the Industrial Era is 15% and the average residence time 4 years.”
by Tony Heller, November 9, 2017 in ClimateChangeDispatch
The animation below shows the extent of 5+ foot thick sea ice at present vs. the same date ten years ago. Ice thinner than five feet thick has been masked out.
Though advocates of the dangerous anthropogenic global warming (AGW) narrative may not welcome the news, evidence that modern day global warming has largely been driven by natural factors – especially solar activity – continues to pile up.
Much of the debate about the Sun’s role in climate change is centered around reconstructions of solar activity that span the last 400 years, which now include satellite data from the late 1970s to present.
Study Bolsters Theory of Heat Source Under West Antarctica
A new NASA study adds evidence that a geothermal heat source called a mantle plume lies deep below Antarctica’s Marie Byrd Land, explaining some of the melting that creates lakes and rivers under the ice sheet. Although the heat source isn’t a new or increasing threat to the West Antarctic ice sheet, it may help explain why the ice sheet collapsed rapidly in an earlier era of rapid climate change, and why it is so unstable today.
by Ron Clutz, November 8, 2017, in ClimateChangeDispatch
The graph [after the jump] is noisy, but the density is needed to see the seasonal patterns in the oceanic fluctuations. Previous posts focused on the rise and fall of the last El Nino starting in 2015.
This post takes a longer view, encompassing the significant 1998 El Nino and since. The color schemes are retained for Global, Tropics, NH and SH anomalies.
Despite the long time frame, I have kept the monthly data (rather than yearly averages) because of interesting shifts between January and July.
President, Europäisches Institut für Klima und Energie (EIKE)
US Climate and Energy Policy after 10 Months Trump
Zero Hour for Climate Alarmists?
Marc Morano
Editor in Chief www.climatedepot.com and Director of Communication CFACT
The German Energiewende – Germany’s Green Path, between Illusion and Reality,
by Deming Kong et al., November 30, 2017 in Quaternary International
High-resolution surface temperature records over the last two millennia are crucial to understanding the forcing and response mechanism of Earth’s climate. Here we report a bidecadal-resolution sea surface temperature (SST) record based on long-chain alkenones in a gravity sediment core retrieved from the northern South China Sea. SST values varied between 26.7 and 27.5 °C, with a total variability ∼1 °C over the last 2000 years.
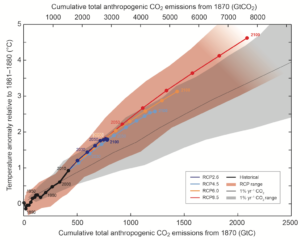
It started as a nice simple idea: There is a finite amount of Carbon that humanity can burn before the planet warms above 2C. This idea was based on AR5 Earth Systems Models (ESMs) ‘showing’ that the relationship between global temperatures and cumulative emissions was linear. At last the IPCC had something easy for world leaders to understand! This was all nicely summarised in Figure SPM-10, shown below. The Paris accord is essentially derived from this one figure.
Radical environmentalists continue to claim that CO2 emissions cause climate change and that global warming, aka, climate change, will bring more severe storms.
Every year, the facts prove them wrong: Storms are not getting more severe or more frequent.
Climate change is back on the agenda with a global climate conference kicking off Monday in the German city of Bonn.
Who’s coming, what are the key debates about and how green will this meeting be? Five things to know about the U.N. conference known as COP23, which runs from Nov. 6-17.
La géologie, une science plus que passionnante … et diverse