The Bray cycle is about 2450 years from beginning to end and the Bray Lows, which are the coldest portion of the cycle, are the most important events.
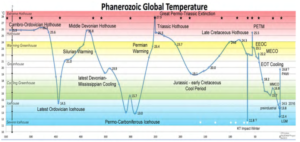
The world is currently within the Quaternary Ice Age and nearly as cold as it has ever been. The normal average temperature of the world is around 20°C, some 5°C warmer than today. To keep recent warming in perspective, it is important to understand that even if the worse predictions of the IPCC were to occur, we would only be returning to the average temperature of the last 560 million years
Prof. Quansheng Ge and his group from the Institute of Geographic Sciences and Natural Resources Research, Chinese Academy of Sciences, collected a large number of proxies and reconstructed a 2000-year temperature series in China with a 10-year resolution, enabling them to quantitatively reveal the characteristics of temperature change in China over a common era.
So… If climate change caused the Vikings to turn their plowshares into swords, abandoning their farms to become terrorists… the climate change would have been of the warming variety. I’m not a farmer, but it seems to me that global warming would have actually enhanced the Vikings’ ability to farm up around the Arctic Circle.
by JoNova, August 7, 2017 in ClimateChangeDispatch
In the mid-1990s thermometers changed right across Australia — new electronic sensors were installed nearly everywhere. Known as automatic weather sensors (AWS) these are quite different to the old “liquid in glass” type.
The electronic ones can pick up very short bursts of heat—so they can measure extremes of temperatures that the old mercury or liquid thermometers would not pick up unless the spike of heat lasted for a few minutes.
It is difficult (impossible) to believe that across the whole temperature range that these two different instruments would always behave in the exact same way.
Finally, we’ve been told for years that volcanic eruptions cause COOLING … although what cooling is visible in the historical record is generally local, small, and short-lasting. But now, they say eruptions cause Northern Hemisphere winter warming? What’s up with that?
by Graham Lloyd, August 4, 2017 in Marc Morano,ClimateDepot
Recorded temperatures at the Bureau of Meteorology’s Thredbo Top automatic weather station have dropped below -10C in the past week, after action was taken to make the facility “fit for purpose”.
A record of the Thredbo Top station for 3am on Wednesday shows a temperature reading of -10.6C. This compares with the BoM’s monthly highlights for June and July, both showing a low of -9.6C.
The BoM said it had taken immediate action to replace the Thredbo station after concerns were raised that very low temperatures were not making it onto the official record.
“Settled” Climate Science apparently needs a lot more hands on deck to help explain to us how doomed we are if we don’t spend taxpayer’s money on climate stuff.
We provide a new confirmation for the link between solar activity and climate cycles by wavelet analysis showing a remarkably good agreement of the power of the ~190 – year period for temperatures and solar activity over 9000 years (see Fig.4. lower panel). As (Fig.2 and Table 2 ) show, the periods of ~1000 and ~460 years are also apparently common in records of temperatures and cosmogenic nuclides.
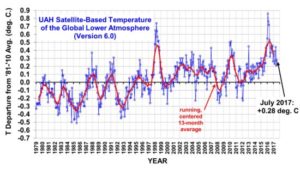
The Version 6.0 global average lower tropospheric temperature (LT) anomaly for July, 2017 was +0.28 deg. C, up a little from the June, 2017 value of +0.21 deg. C
J’ai eu l’immense honneur et le plaisir de côtoyer à de multiples reprises le Professeur Istvàn Marko.
C’était vraiment une personnalité exceptionnelle, tant sur le plan humain que scientifique. Sa disparition inopinée laisse un vide profond, et un grand désarroi parmi ceux qui l’ont connu
L’hommage de Drieu Godefridi à István Markó, esprit libre et grand scientifique qui s’est attaché à donner ses titres de noblesse à la science du climat.
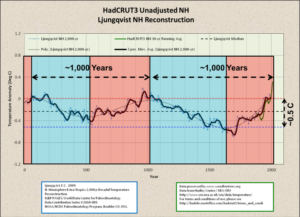
Today ‘warm’ is strongly connected with ‘climate change’, if not with ‘dangerous climate change’. In the minds of people ‘cold’ should be more stable. But, paleo data show that it is‘cold’ that is unstable. While ‘warm’ always shows a high stability in climatic conditions.
The purpose of this study is to present robust evidence that the sun is working with water vapour to control the Earth’s climate and to show that the influence of CO2 on atmospheric temperature is so small as to be negligible.
The chart below is taken directly from figures provided by the U.S. government’s Carbon Dioxide Information Analysis Center (CDIAC) website, specifically its 2016 Global Carbon Project spreadsheet on the Historical Budget tab. In terms of gigatons of carbon, and from 1770 to 2004, it itemizes the growth rate of radiative forcing by atmospheric CO2 and the growth rate of oceanic absorption, what is known as a “carbon sink.”
by Tony Heller, July 29, 2017 in DeplorableClimateScinceBlog
The New York Times said yesterday that heatwaves in the past were “virtually unheard of in the 1950s”, temperatures approaching 130 degrees didn’t used to occur, and summer temperatures have shifted towards more extreme heat.
(…) Every single claim in the article is patently false, and the exact opposite of reality. The authors intentionally started their study in a cold period, after the extreme heat of the 1930’s.
Now that the alarmists have had their day trumpeting the IPCC’s worst case scenario (it’s unlikely and becoming more so), let’s look at their best case scenario (hidden by journalists). The risk probabilities are asymmetric: the good news is more likely than the bad news. This is inspirational, telling people that we can make a better world.
About half of the CO2 emitted by man gets absorbed by the oceans and so does not stay in the atmosphere. Here there are certain areas of the ocean that are especially efficient CO2 sinks, while others do not absorb so well. What follows is a look of the newest literature on the subject.
A new study shows that difference in water temperature between the Pacific and the Atlantic oceans together with global warming impact the risk of drought and wildfire in southwestern North America.
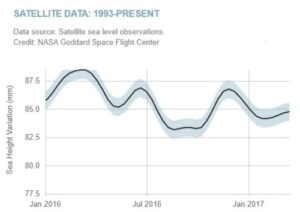
That’s right, according to NASA, sea levels are going DOWN! This is big news. How come the media hasn’t mentioned it?
NASA satellite sea level observations for the past 24 years show that – on average – sea levels have been rising 3.4 millimeters per year. That’s 0.134 inches, about the thickness of a dime and a nickel stacked together, per year.
However, China, the new climate-change champion, is leading the charge in a global building splurge that will see 1,600 of those dirty, villainous coal-fired power plants all across our planet. Even the New York Times, one of the most fervent voices of catastrophic global-warming alarmism — and one of the most vociferous critics of Trump’s decision to dump Obama’s Paris climate deal — has admitted that China’s coal plans make it “virtually impossible” to meet the Paris accord goals.
Well, Dr. James Hansen, the man who invented the global warming scam and our favorite failed serial doomcaster, recently addressed the cratering of a 30-year prediction he made in 1988.
Back then, he said the globe would warm up by one full degree by 2018 under the “business as usual” rubric … not. Here’s the story as written up in “Spin” magazine in 1988.
There’s a recent and good post here at WUWT by Larry Kummer about sea level rise. However, I disagree with a couple of his comments, viz …
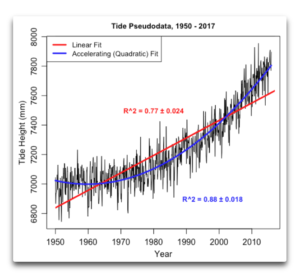
This question all revolves around whether the rate of sea level rise is relatively steady, or whether it is accelerating … so how do we tell the difference?
When I read that, I (like everyone else) assumed that corrections to the satellite sea level data since 1993 have now led to a revised trend toward faster (not slower) sea level rise. Right?
A commentary appearing here at the Swiss Baseler Zeitung (BAZ) slams a recently published British paper on moss growth in Antarctica that gave the impression the south polar continent was greening up due to climate change.
The BAZ writes that the paper is an example of “how today science is manipulated and used for political purposes“.
La géologie, une science plus que passionnante … et diverse