by David Middleton, December 6, 2019 in WUWT
The accuracy of the failed models improved when they adjusted them to fit the observations… Shocking.
The AGU and Wiley currently allow limited access to Hausfather et al., 2019. Of particular note are figures 2 and 3. I won’t post the images here due to the fact that it is a protected limited access document.
Figure 2: Model Failure
Figure 2 has two panels. The upper panel depicts comparisons of the rates of temperature change of the observations vs the models, with error bars that presumably represent 2σ (2 standard deviations). According to my Mark I Eyeball Analysis, of the 17 model scenarios depicted, 6 were above the observations’ 2σ (off the chart too much warming), 4 were near the top of the observations’ 2σ (too much warming), 2 were below the observations’ 2σ (off the chart too little warming), 2 were near the bottom of the observations’ 2σ (too little warming), and 3 were within 1σ (in the ballpark) of the observations.

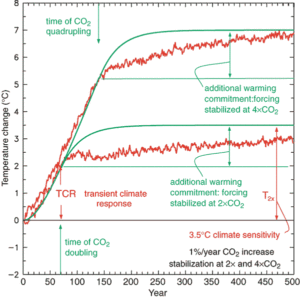
Figure 2. Equilibrium climate sensitivity (ECS) and transient climate response
…
