Comme déjà mentionné dans un article précédent publié sur SCE, la variation de la couverture nuageuse a probablement un effet majeur sur la température moyenne globale de la basse atmosphère. Si l’on veut prédire le climat du futur comme le prétend le GIEC il faut savoir modéliser la formation des nuages. Que nous dit le dernier rapport scientifique (AR5) du GIEC à ce sujet? Le but du présent article est simplement de vous présenter quelques phrases tirées de ce rapport. La science est-elle dite?
1. Le chapitre 7 du rapport AR5 publié par le GIEC en 2013
Le chapitre 7 du rapport AR5 du GIEC[1] fait 60 pages et est consacré aux nuages et aux aérosols (le rapport AR5 complet fait au total 1535 pages). Ce chapitre 7 comporte 22 pages de références et cite plus de 1100 articles scientifiques publiés dans des revues aussi prestigieuses que Science, Nature ou PNAS. Le chapitre 7 a été écrit sous la direction de Olivier Boucher (France) et David Randall (USA), deux spécialistes du domaine. Nous n’allons pas ici remettre en question la validité de ce chapitre. Nous allons simplement vous présenter quelques phrases tirées du rapport. Comme le rapport est écrit en anglais nous vous proposerons ci-dessous une “traduction maison” des phrases qui nous paraissent les plus importantes, assorties parfois de quelques explications pour bien les comprendre. Les lettres entre crochets ([A] à [P]) renvoient simplement au texte original en anglais, donné en Annexe du présent article.
The word “hysteresis” doesn’t immediately seem threatening; it hints at a portmanteau of “history” and “thesis”—a dense read, perhaps, but those never killed anyone. But that’s not what the word means. Hysteresis is a profound behavior some systems can display, crossing a sort of point-of-no-return. Dial things up just one notch, and you can push the system through a radical change. To get back to normal, you might have to dial it down five or six notches.
Earth’s climate system can provide examples. Take the conveyor-belt-like circulation of water in the Atlantic Ocean. Looking back at the past, you can see times that the circulation seems to have flipped into an alternate pattern regarding climatic consequences around the North Atlantic. Switching from one pattern to the other takes a significant nudge, but reversing it is hard—like driving up to the top of a ridge and rolling down into the next valley.
…
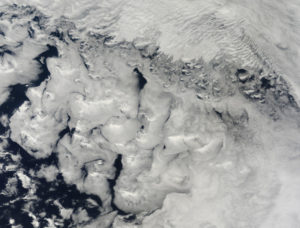
Stratocumulus clouds, like those in the lower two-thirds of this image, are common over the oceans.
How much impact does the abundance of cloud condensation nuclei (CCN) aerosols above the oceans have on global temperatures? Rosenfeld et al.analyzed how CCN affect the properties of marine stratocumulus clouds, which reflect much of the solar radiation received by Earth back to space (see the Perspective by Sato and Suzuki). The CCN abundance explained most of the variability in the radiative cooling. Thus, the magnitude of radiative forcing provided by these clouds is much more sensitive to the presence of CCN than current models indicate, which suggests the existence of other compensating warming effects.
Researchers from Leipzig cooperate with scientists from Punta Arenas (Chile) to learn more about the relationship between air pollution, clouds and precipitation.
Leipzig/Punta Arenas. How do airborne particles, so-called aerosols, affect the formation and life cycle of clouds and precipitation? In order to come one step closer to solving this question, atmospheric scientists from the Leibniz Institute for Tropospheric Research (TROPOS) and the Leipzig Institute for Meteorology (LIM) at Leipzig University will observe the atmosphere at one of the cleanest places in the world for at least a year. The choice fell on Punta Arenas because the city is located on a comparable geographical latitude as Germany and will thus enable comparisons between the northern and southern hemispheres. The measurement campaign is part of the International Year of Polar Prediction (YOPP), which aims to improve weather and climate forecasts for the polar regions through intensive measurements.
Princeton University researchers have found that the climate models scientists use to project future conditions on our planet underestimate the cooling effect that clouds have on a daily — and even hourly — basis, particularly over land.
The researchers report in the journal Nature Communications Dec. 22 that models tend to factor in too much of the sun’s daily heat, which results in warmer, drier conditions than might actually occur. The researchers found that inaccuracies in accounting for the diurnal, or daily, cloud cycle did not seem to invalidate climate projections, but they did increase the margin of error for a crucial tool scientists use to understand how climate change will affect us.
Reflecting upon my previous post, Where The Temperature Rules The Sun, I realized that while it was valid, it was just about temperature controlling downwelling solar energy via cloud variations. However, it didn’t cover total energy input to the surface. The total energy absorbed by the surface is the sum of the net solar energy (surface downwelling solar minus surface reflections) plus the downwelling longwave infrared, or DWIR. This is the total energy that is absorbed by and actually heats the surface.
Until cloud and precipitation data are adequate AND accounted for properly AND the error bands are low enough to cover 1/10 degree increments, we can’t say there is ANY effect from CO2 on temperature. It is at most a conjecture, and not a very good one. You can not ignore the major driver of changes of temperatures (as shown in the above graph) and then attribute temperature changes to something else by supposition.
La géologie, une science plus que passionnante … et diverse