The thousands of metric tons of carbon dioxide (CO2) emitted from power plants each year doesn’t have to go into the atmosphere. Researchers are optimistic that within the next decade we will be able to affordably capture CO2 waste and convert it into useful molecules for feedstock, biofuels, pharmaceuticals, or renewable fuels. On March 29 in the journal Joule, a team of Canadian and US scientists describe their vision for what we should make with CO2 and how we can make it.
by Nic Lewis, March 29, 2018 in ClimateAudit (Steve McIntyre)
The two strongest potentially credible constraints, and conclusions
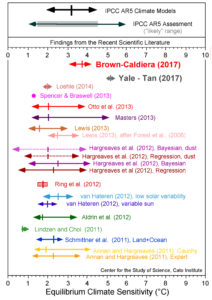
In Part 1 of this article the nature and validity of emergent constraints[1] on equilibrium climate sensitivity (ECS) in GCMs were discussed, drawing mainly on the analysis and assessment of 19 such constraints in Caldwell et al. (2018),[2] who concluded that only four of them were credible. An extract of the rows of Table 1 of Part 1 detailing those four emergent constraints is given below.[3]
WUWT readers may recall this chart which clearly illustrates just how uncertain climate science really is.
t seems that some climate academics are a bit embarrassed that they haven’t been able to pin down climate sensitivity. From EU Horizon Magazine
Climate sensitivity – reducing the uncertainty of uncertainty
by Jon Cartwright
A study published in January 2018 claims to halve the uncertainty around how much our planet’s temperature will change in response to rising carbon dioxide (CO2) levels, potentially giving governments more confidence to prepare for the future.
In June 23, 1988 the Senate Committee on Energy and Natural Resources held a hearing addressing the Greenhouse Effect and Global Climate Change.
Among the presenters at this hearing was Dr. James Hansen, Director, NASA Goddard Institute for Space Studies who introduced his infamous and now debunked global surface temperature model results with future temperature projections under three different scenarios of CO2 emissions growth that grossly over exaggerated resulting projected global temperature increases.
Yet Germany’s image as selfless defender of the climate, which was once largely deserved, is now a transparent fiction. Germany has fallen badly behind on its pledges to sink its own greenhouse gas pollutants. In fact, Germany’s carbon emissions haven’t declined for nearly a decade and the German Environment Agency calculated that Germany emitted 906 million tons of CO2 in 2016 — the highest in Europe — compared to 902 million in 2015. And 2017’s interim numbers suggest emissions are going to tick up again this year.
Not quite a year ago (April 18, 2017) I authored a post on the completion of the Petra Nova carbon capture project at the W. A. Parrish coal-fired power plant in Fort Bend County, Texas. Petra Nova was billed as “the largest post-combustion carbon capture project in the world.” In addition to capturing CO2 from a very large coal-fired power plant, Petra Nova was also designed to serve a useful purpose: Deliver CO2 for enhanced oil recovery to West Ranch Oil Field in Jackson County, Texas. The ultimate goal is to boost production in the field from around 500 barrels of oil per day (BOPD) to 15,000 BOPD and recover about 60 million barrels that would otherwise have been left in the ground.
EIA had an update on the carbon capture aspect back in October…
by Tony Heller, March 8, 2018 in TheDeplorableClimateScience
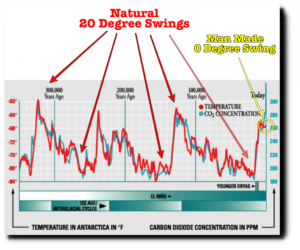
Antarctic ice cores show regular swings in temperature of more than 20 degrees. These were all natural, but the recent zero degree swing was caused by your SUV (…)
As the Earth’s surface and atmosphere warm, the amount of moisture – water vapour – in the atmosphere will increase. Understanding the size of this increase is important for predicting future climates as water vapour is a significant greenhouse gas. Atmospheric moisture content also influences the patterns and intensity of rainfall events.
The relationship between temperature and moisture content can be explored by the study of intervals in Earth’s history when climates where significantly warmer than those seen in modern times, which necessitates a method for estimating ancient atmospheric moisture content.
European Union nations are poised to endorse the biggest overhaul of the market they created more than a decade ago to rein in pollution, a move that may lift prices of power generated from fossil fuels.
The measures, due for final approval in Brussels on Tuesday, impose tougher requirements on thousands of companies to reduce greenhouse gases or pay higher costs for their carbon dioxide emissions. They’re part of a plan to clear up a flaw in the market that left the cost of CO2 permits well below the level needed to stir investments in green energy.
by P. Homewood, February 22, 2018 in NotaLotofPeopleKnowThat
These are the highlights:
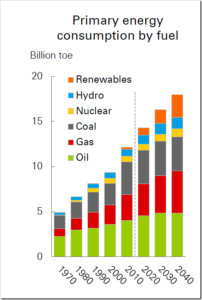
The speed of the energy transition is uncertain and the new Outlook considers a range of scenarios. Its evolving transition (ET) scenario, which assumes that government policies, technologies and societal preferences evolve in a manner and speed similar to the recent past, expects
From the EUROPEAN COMMISSION JOINT RESEARCH CENTRE and the “Dr. Roger Pielke Sr. was right” department. I suspect a whole bunch of climate models that don’t take this into consideration, and think CO2 is the dominant climate driver, are going to need to be revised.
Land use change has warmed the Earth’s surface
Natural ecosystems play a crucial role in helping combat climate change, air pollution and soil erosion. A new study by a team of researchers from the Joint Research Centre, the European Commission’s science and knowledge service, sheds light on another, less well-known aspect of how these ecosystems, and forests in particular, can protect our planet against global warming.
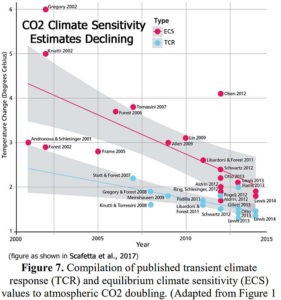
A recently highlighted paper published by atmospheric scientists Scafetta et al., (2017) featured a graph (above) documenting post-2000 trends in the published estimates of the Earth’s climate sensitivity to a doubling of CO2 concentrations (from 280 parts per million to 560 ppm).
The influence of pHsw on both pHcf and the calcification rate of Neogoniolithon is plotted in Figure 1 below. As indicated there, this coralline algal species is able to elevate its pHcf so as to increase its rate of calcification under moderate levels of ocean acidification (pHsw of 7.91 and 8.05), which increase the authors say is “most likely due to CO2-fertilization of [algal] photosynthesis” that is limited in Neogoniolithon at these lower pCO2 conditions. (….)
Climate change is a reality attested by past records. Concerns about preparing and adapting for climate change are real. However, the idea that we can prevent climate change from happening is dangerous and might be anti-adaptive. Certain energy policies that might have no effect on climate change could make us less able to adapt.
Physics shows that adding carbon dioxide leads to warming under laboratory conditions. It is generally assumed that a doubling of CO2 should produce a direct forcing of 3.7 W/m2 [1], that translates to a warming of 1°C (by differentiating the Stefan-Boltzmann equation) to 1.2°C (by models taking into account latitude and season). But that is a maximum value valid only if total energy outflow is the same as radiative outflow. As there is also conduction, convection, and evaporation, the final warming without feedbacks is probably less. Then we have the problem of feedbacks that we don’t know and cannot properly measure. For some of the feedbacks, like cloud cover we don’t even know the sign of their contribution. And they are huge, a 1% change in albedo has a radiative effect of 3.4 W/m2 [2], almost equivalent to a full doubling of CO2.
Experts say one annual increase doesn’t indicate China is returning to an era when its emissions grew by leaps and bounds. But the increase illustrates the challenges and compromises Beijing must juggle if it wants to stoke its economy and at the same time keep its environmental promises. […]
The researchers published their findings this week in the Proceedings of the National Academy of Sciences.
Scientists frequently look to the Eocene to understand how the Earth responds to higher levels of carbon dioxide. During the Eocene, the concentration of carbon dioxide in the atmosphere was more than 560 parts per million, at least twice preindustrial levels, and the epoch kicked off with a global average temperature more than 8 degrees Celsius – about 14 degrees Fahrenheit – warmer than today, gradually cooling over the next 22 million years. These characteristics make the Eocene a good period on which to test our understanding of the climate system, said Laura Cotton, study co-author and curator of micropaleontology at the Florida Museum of Natural History.
It has long been dawning on most people that the costs of Germany’s Energiewende (transition to green energies) have been spectacularly underestimated. As Germany rushes into its foray with renewable energies, principally wind and sun, we are finding out that many of the costs involved were never taken into account.
The short answer to the question posed in the title to this article is virtually and practically nothing. They definitely do not tell us what is claimed, that is, accurate representation of the state of the atmosphere including temperature in individual years. This is why one of the world’s experts on atmospheric chemistry and ice cores Zbigniew Jaworowski M.D., Ph.D., D.Sc., wrote,
“It was never experimentally demonstrated that ice core records reliably represent the original atmospheric composition.”
La fermeture des centrales nucléaires belges pourrait entraîner une augmentation de 50% des émissions de CO2 liées à la production d’énergie d’ici 2030, selon le professeur d’économie Johan Albrecht (UGent – Université de Gand), qui est également membre de l’institut de réflexion Itinera. Cela alors que le gouvernement fédéral et les entités fédérées doivent négocier dans les semaines à venir le Pacte énergétique, qui doit fixer l’avenir de la production d’électricité en Belgique.
Other countries are failing to meet their targets, but we’re not only achieving them, we’re overdoing it. And this is despite our obvious handicaps: like that we have rapid population growth, are further from everywhere and anywhere* except for Antarctica, and we’re the largest coal exporter in the world;
by David Kirtley, December 28, 2017, in SkepticalScicence
In Part 1, we learned about carbon isotopes: how 14C forms in the atmosphere, how different isotopes move through the Carbon Cycle, and how isotopic measurements reveal clues about our changing climate. In this post we will look at how measurements of changing isotopic ratios are described.
by Fred Pearce, December 19, 2017 in Yale Environment360
In September, some 200 scientists wrote to the EU insisting that “bioenergy [from forest biomass] is not carbon-neutral” and calling for tighter rules to protect forests and their carbon. Yet just a month later, EU ministers rubber-stamped the existing carbon accounting rules, reaffirming that the burning of wood pellets is renewable energy.
For the first time scientists have directly observed living bacteria in polar ice and snow — an environment once considered sterile. “As microbial activity and its influence on its local environment has never been taken into account when looking at ice-core gas samples it could provide a moderate source of error in climate history interpretations.”
Les prévisions climatiques à très long terme (2100) sont établies à l’aide de modèles qui ne sont rien d’autre des logiciels très complexes, dont le but est de reproduire le comportement du climat terrestre.
Comme on ne peut pas décrire ce qui se passe en tous les points de la terre, celle-ci est découpée en mailles de quelques centaines de kilomètres de côté. Les modèles utilisés par le GIEC pour son cinquième rapport d’évaluation (2013) avaient des résolutions relativement grossières (supérieures à 100 km). La situation évolue toutefois rapidement et les modèles climatiques les plus récents auraient une résolution plus fine (de l’ordre de 20 km).