Archives par mot-clé : CO2

Microbes that co-operate contribute more carbon emissions

by Imperial College London, Feb 13, 2023 in ScienceDaily


Despite being small, microbes, and especially bacteria, contribute a lot to the global carbon cycle — the movement of carbon in various forms through nature. Its level in the atmosphere, and so its influence on climate change, is controlled by a series of sources and sinks, such as respiration and photosynthesis respectively.

Now, new research from Imperial College London and University of Exeter scientists has shown that, when warmed, bacterial communities that have matured to co-operate release more carbon dioxide (CO2) than communities that are in competition with each other.

The results are published in Nature Microbiology.

Co-author Dr Tom Clegg, who led the theory development from the Department of Life Sciences (Silwood Park) at Imperial, said: “Our findings have far-reaching implications given the significant contributions that bacterial communities make to the carbon cycle. We show that changes in bacterial species interactions can rapidly and substantially increase the carbon emissions from natural ecosystems worldwide.”

Bacteria — like humans — respire, taking in oxygen and releasing CO2. Of the many factors that control their level of respiration, temperature is particularly important.

Bacteria form communities of different species in all habitable environments, including in soil, puddles, and in our guts. When communities first form, the bacterial species are often ‘competitive’, each trying to get the best resources.

Forest-Limit (Betula pubescens ssp. czerepanovii) Performance in the Context of Gentle Modern Climate Warming

by Kullman, Feb 6, 2023 in NoTricksZone


Claims the Swedish Scandes are unprecedentedly warm and tree-covered today “appear as large and unfounded exaggerations,” as the “climate and arboreal responses” of the last few decades “are still inside the frames of natural historical variation.” – Kullman, 2022 and Kullman, 2022a

Extensive birch forest fossils can be dated to the early- to mid-Holocene in northern Scandinavian regions, indicating these warmth-sensitive trees could exist in climates that are too cold for them to grow in today. This documents a much warmer period, “at least 3°C higher than during the past few decades,” 3000 to 10,000 years ago, or when CO2 was about 265 ppm (Kullman, 2022).

Contrary to modeler opinions, “there is little factual nourishment” to support modern projections that the Swedish Scandes will soon be returning to the subalpine birch forest climates of past millennia. The observed forest advancement in recent decades “is so small” that these modeling claims appear to be “unfounded exaggerations.”

Kullman, 2022

“In the southernmost Swedish Scandes, pine has already “leap-frogged” over receding the birch forest-limit (Kullman 2014, 2019). That scenario would mimic the arboreal landscape during the early Holocene and shift to a landscape unseen for thousands of years (cf. Blűthgen 1942; MacDonald et al. 2008, Macias-Fauria et al. 2012). During that epoch, summer temperatures are inferred to have been at least 3°C higher than during the past few decades.”
“At the landscape level, the obtained changes contribute to a greater and lusher landscape, in contrast to the dire conditions during the Little Ice Age, more than 100 years ago (Kullman 2010, 2015). Currently, there is little factual nourishment to flourishing projections stating that a major part of Swedish alpine areas is on verge of transformation to subalpine birch forest (e.g. Moen et al. 2004). Apparently, climate and arboreal responses are still inside the frames of natural historical variation, as inferred by several authors (e,g. Hammarlund et al. 2004; Bergman et al. 2005; Kullman 2013, 2017a, b; Kullman & Öberg 2018, 2020).”
“Given that the current relatively warm climate phase continues, the subalpine birch forest belt may eventually recede and give way to a subalpine pine belt. The obtained modest forest-limit advancement is so small that flourishing model simulations of extensive birch forest expansion over most of the current alpine tundra appear as large and unfounded exaggerations.”

Tree remnants (trunks, cones, roots, etc.) found at northern Sweden mountain sites 500 to 700 meters atop where the 21st century tree line ends imply the early-Holocene (~13,000 to 7000 years ago) climate was significantly warmer than today in this region (Kullman, 2022a).

The temperature lapse rate for the Swedish Lapland region is 0.6°C/100 m. Accounting for glacio-isostatic uplift, this tree line elevation implies surface air temperatures were 3.6°C higher than today during the Early Holocene.

Kullman, 2022a

….

In Search Of A (Near) Perfect CO2 Global Warming Analogy

by R. Barmby, Jan 23; 2023 in ClimateChangeDispatch


Most people have a firm opinion on whether human emissions of carbon dioxide (CO2) are causing unnatural global warming, and hold that opinion without understanding how the molecule physically absorbs and then releases heat energy.

Understanding that mechanism reveals why today’s significant global CO2 emissions are insignificant to future global warming.

Analogies are a great way to explain science, and I’m going to share the worst and best analogies for how carbon dioxide acts as a greenhouse gas. I will also share why the warming effect of CO2 is limited.

Why Today’s Carbon Dioxide Emissions Are Insignificant To Global Warming

As more CO2 molecules are added as potential absorbers for the fixed amount of the specific band of infrared radiation, there is less chance that any CO2 molecule will be hit. If the additional CO2 molecules do not absorb infrared radiation, they cannot contribute to global warming.

The ever-reducing CO2 contribution to global warming looks like this graph, which, ironically, is based on the IPCC’s formula (from Inconvenient Facts by Gregory Wrightstone):

On the graph above, consider that the pre-industrial (circa 1875) atmospheric CO2 level was about 280 parts per million (ppm), and today it is about 420 ppm—an increase of 140 ppm.

As a rough approximation, the three bars labeled 350, 400, and 450 ppm represent this past increase in CO2, and the sum of the global warming temperature increases associated with those three bars is about 0.7°C.

The next four bars (500, 550, 600, and 650 ppm) represent a future CO2 increase of 200 ppm, which at today’s rate of 2.5 ppm increase each year would take from now to about 2100.

The global warming associated with those four bars is only 0.65°C. The graph shows it keeps taking more CO2 to achieve a smaller amount of global warming.

I chose bars 350 through 650 ppm to highlight that the IPCC’s formula predicts that global warming from current CO2 emissions held flat (1.35°C) would still beat the IPCC’s target of 1.5°C of human-caused global warming from preindustrial times to the year 2100.

The above graph suggests global warming from increasing CO2 never stops, but we know from ancient climates that even 12 times today’s CO2 concentrations did not cause runaway global warming.

Drs. Happer, Koonin, and Lindzen submitted to the U.S. (Northern California) District Court in 2021 that minor changes in cloud cover and convection currents can have a bigger effect on the Earth’s surface temperature than major increases in CO2.

Mauna Loa Observatory

by Climate Auditor, January 2023


Atmospheric CO2 concentration

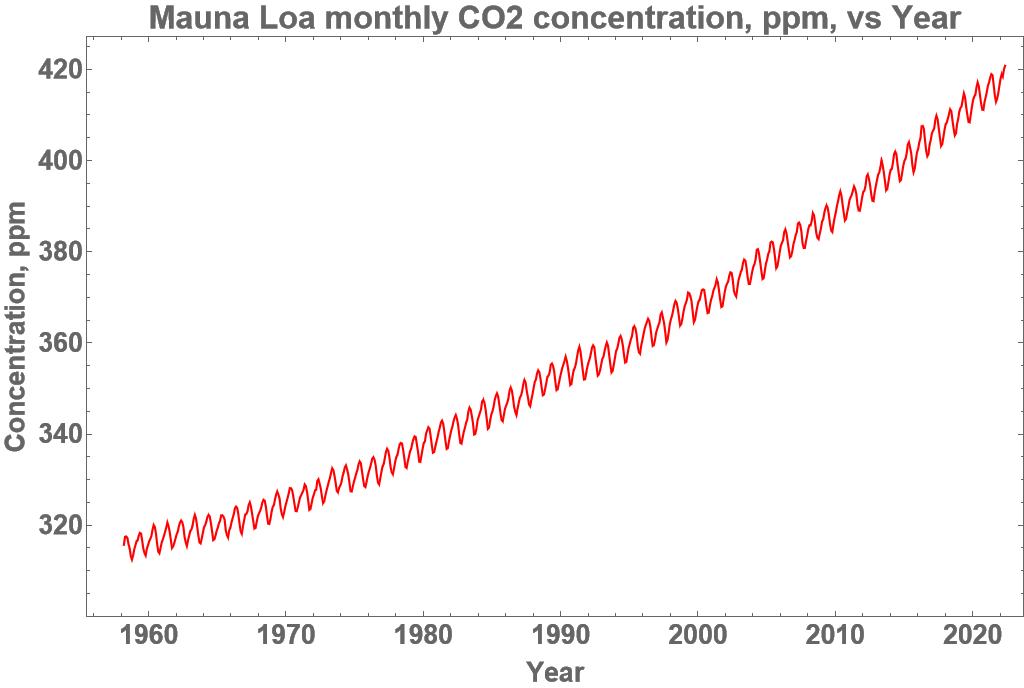
Here in Figure 1 is the monthly atmospheric CO2 concentration measured at the Mauna Loa Observatory, Hawaii, Latitude19.5̊ N, Longitude 155̊ W, elevation 3397m, for the 64 year period from March 1958 to May 2022.

Figure 1. Monthly atmospheric CO2 concentration, Mauna Loa Observatory, Source:[ Ref. 2]

The source file, Ref. 2, lists the data in 10 columns. The columns used here were columns 3 and 4, the date in Excel and decimal format, column 9 being the measured CO2 concentration with missing values in-filled from a smoothed fit to the data and column 10 being the seasonally adjusted measurements again with missing values in-filled.

The monthly CO2 concentration had an average rate of increase over the 64 year period from March 1958 to May 2022 of 1.60 ppm pa. For the 5 year period March 1958 to March 1963 the rate was 0.68 ppm pa and for the 5 year period May 2017 to May 2022 the rate was 2.50 ppm pa, that is, the rate of increase has steadily accelerated over time to be 3.7 times greater than it was 59 years earlier. The range was from a minimum of 312.43 ppm to a maximum of 420.78 ppm.

The amplitude of the seasonal variation was estimated to range from 5.25 ppm to 8.03 ppm, increasing in amplitude over time, in an irregular fashion. The maxima occurred, on average, in early May, which is the beginning of Summer, and the minima in late September, at the end of Summer. The greatest seasonal variation took place between September 2015 and April 2016. This means that the CO2 concentration rose during the cool of Winter and fell during the heat of Summer, which is out of phase with the UN IPCC claim that increased CO2 concentration causes an increase in temperature. Nor does the UN IPCC hypothesis provide an explanation for the steady increase in the rate of increase of the CO2 concentration.

Temperature and CO2 concentration

Here is 522 months of empirical data, showing a distinct lack of a relationship between the Tropics satellite lower troposphere temperature [ Ref.1] and the seasonally adjusted atmospheric CO2 concentration at the Mauna Loa Observatory.


Figure 2. Mauna Loa Observatory, Source: [ Ref. 1] and [ Ref. 2]

Figure 2 shows the monthly satellite lower troposphere temperature for the Tropics zone, 20̊ South to 20̊ North, in blue, and the relevant monthly CO2 concentration in red after removal of the seasonal variation so as to match the residual temperature series. The range for the monthly CO2 concentration is from 335.77 ppm to 418.2 ppm. The range for the Tropics temperature is from -0.99̊ Celsius to +1.15̊ Celsius with respect to a 30 year average base value. The clear and obvious difference between the two raises the possibility that there may be no common causal factor whereby the CO2 concentration drives the temperature as claimed by the UN IPCC.

Calculation of the Ordinary Linear Regression between the two time series gave a Pearson correlation coefficient of 0.462 from the 522 monthly data pairs. This is a measure of the relationship between the background linear trend of each of the time series as shown by an almost identical correlation of 0.463 between the temperature and the time. The correlation between the CO2 concentration and the time was 0.995, that is, the seasonal adjusted CO2 concentration time series was practically a linear trend with respect to time. Any pair of linear trends, no matter what their source, will have a high correlation coefficient of about 1.0 which is necessarily of no causal significance as a background linear trend with respect to time can be calculated for any time series.

New Study: A ‘Thought Model’ Saying There’s A 33 K ‘Natural Greenhouse Effect’ Is ‘Meritless’ Assumption

by K. Richard, Dec 26, 2022 in NoTricksZone


The conceptualization of a 33 K warmer Earth due to the presence of water vapor and CO2 (greenhouse gases) in the atmosphere is wholly based on the unobserved and unknown, or assumptions about what an imaginary world with no atmosphere would be like.

It is widely believed that we can determine the effective radiating temperature, a uniformly global temperature, the globally uniform albedo…of a rocky planets simply by conjuring up thought experiments about what a made-up world would be like if it did not have an atmosphere (e.g., no N2, O2, atmospheric pressure, clouds, water vapor…).

This “thought model” has been subjected to critical analysis in a new paperpublished by four atmospheric physicists.


Image Source: Kramm et al., 2022

The authors use observational measurements from 24 datasets for the moon — which actually is the closest real-world proximity to a rocky planet without an atmosphere — as their testbed. They conclude that the globally averaged surface temperature is necessarily “about 60 K” lower than the effective radiation temperature, rendering the “thought model” presumptions about a 33 K “greenhouse effect” differential for the effective radiating vs. global average temperature (255 vs. 288 K) “meritless.”

Other instances of a disqualifying contrast between observations and modeled assumptions include:

What If Real-World Physics Do Not Support The Claim Top-Of-Atmosphere CO2 Forcing Exists?

by K. Richard, Dec 22, 2022 in NoTricksZone


 Schneider et al., 2020, NASA, UCAR, CGA

TOA greenhouse gas forcing is a fundamental tenet of the CO2-drives-climate-change belief system. And yet the “global-mean longwave radiative forcing of CO2 at TOA” (Schneider et al., 2020) may not even exist.

It is easily recognized that water vapor (greenhouse gas) forcing cannot occur above a certain temperature threshold because water freezes out the farther away from the surface’s warmth H2O goes.

According to NASA, the TOA is recognized as approximately 100 km above the surface. The temperature near that atmospheric height is about -90°C.

CO2 is in its solid (dry ice) form at -78°C and below.

Therefore, TOA CO2 radiative forcing cannot exist if CO2 cannot be a greenhouse gas at the TOA.

New Study: Observational Data Affirm 95% Of Post-1970s Warming Is Not Linked To CO2 Increases

by K. Richard, Dec 8, 2022 in NoTricksZone


Of the warming trends in Poland and greater Europe, “only about 4–5% are explained by an increase in CO2 concentration.”  –  Marsz et al., 2022 

Internal changes to the thermal structure of the ocean transmit decadal-scale changes in the atmospheric circulation and consequent surface air temperature via its modulating impact on the variation in the amount and intensity of solar radiation (sunshine duration, or SD) reaching the Earth’s surface.

This is not only observed for Poland and/or Europe as detailed in a new study, but the causal structuring of cloud cover changes driving the variations in solar radiation reaching the surface and modulating climate can be applied throughout the globe ( Wang et al., 2002, Wielicki et al., 2002Loeb et al., 2021, Herman et al., 2013Poprovsky, 2019, Dübal and Vahrenholt, 2021, Swift, 2018, Stephens et al., 2022).

Therefore, “the main cause of the change in the state of the climate may be the action of the internal variability of the ocean–atmosphere system” (Marsz et al., 2022).

Study Finds The CO2 Greenhouse Effect Is Real…But Dangerous Global Warming From Rising CO2 Is Not

by K. Richard, Nov 24, 2022 in NoTricksZone


German physicists claim to have experimentally demonstrated the greenhouse effect from greenhouse gases like CO2 and CH4 is a real phenomenon, but assess the climate sensitivity to a doubling of CO2 with feedbacks is “only ECS = 0.7°C … 5.4x lower than the mean value of CMIP6 with ECS = 3.78°C.”

“The derived forcing for CO2 is in quite good agreement with some theoretical studies in the literature, which to some degree is the result of calibrating the set-up to the spectral calculations, but independently it determines and also reproduces the whole progression as a function of the gas concentration. From this we deduce a basic equilibrium climate sensitivity (without feedbacks) of ECSB = 1.05°C. When additionally assuming a reduced wing absorption of the spectral lines due to a finite collision time of the molecules this further reduces the ECSB by 10% and, thus, is 20% smaller than recommended by CMIP6 with 1.22°C.”
“Detailed own investigations also show that in contrast to the assumptions of the IPCC water vapor only contributes to a marginal positive feedback and evaporation at the earth’s surface even leads to a significant further reduction of the climate sensitivity to only ECS = 0.7°C (Harde 2017 [15]). This is less than a quarter of the IPCC’s last specification with 3°C (see AR6 [1]) and even 5.4x lower than the mean value of CMIP6 with ECS = 3.78°C.”

ORIGIN OF THE RECENT CO2 INCREASE IN THE ATMOSPHERE

by F. Engelbeen, Nov 2022


In climate skeptics circles, there is rather much confusion about historical/present CO2 measurements. This is in part based on the fact that rather accurate historical direct measurements of CO2 in the atmosphere by chemical methods show much higher values in certain periods of time (especially around 1942), than the around 280 ppmv which is measured in Antarctic ice cores. 
280 +/- 10 ppmv is assumed to be the pre-industrial amount of CO2 in the atmosphere during the current interglacial (the Holocene) by the scientific community. This is quite important, as if there were (much) higher levels of CO2 in the recent past, that may indicate that current CO2 levels are not from the use of fossil fuels, but a natural fluctuation and hence its influence on temperature is subject to (huge) natural fluctuations too and the current warmer climate is not caused by the use of fossil fuels.

To be sure about my skepticism: I like to see and examine the arguments of both sides of the fence, and I make up my own mind, based on these arguments. I am pretty sure that current climate models underestimate the role of the sun and other natural variations like ocean oscillations on climate and overestimate the role of greenhouse gases and aerosols. But I am as sure that the increase of CO2 in the atmosphere since the start of the industrial revolution is mainly from the use of fossil fuels.

There are several reasons why the hypothesis of large non-human CO2 variations in recent history is wrong (see my comment on the late Ernst Beck’s compilation of historical measurements) and that most of the recent increase in CO2 in the atmosphere indeed is mainly man-made, but that needs a step-by-step explanation. Follow the steps: 

  1. Evidence of human influence on the increase of CO2 in the atmosphere.

    1. The mass balance
    2. The process characteristics
    3. The 13C/12C ratio
    4. The 14C/12C ratio
    5. The oxygen use
    6. The Ocean’s pH and pCO2
    7. The processes involved
  2. Conclusion

  3. Extra: how much human CO2 is in the atmosphere?

  4. Reference

….
….

Mid-Pleistocene transition in glacial cycles explained by declining CO2 and regolith removal

by Willeit et al., 2019 in ScienceAdvances

Abstract

Variations in Earth’s orbit pace the glacial-interglacial cycles of the Quaternary, but the mechanisms that transform regional and seasonal variations in solar insolation into glacial-interglacial cycles are still elusive. Here, we present transient simulations of coevolution of climate, ice sheets, and carbon cycle over the past 3 million years. We show that a gradual lowering of atmospheric CO2 and regolith removal are essential to reproduce the evolution of climate variability over the Quaternary. The long-term CO2 decrease leads to the initiation of Northern Hemisphere glaciation and an increase in the amplitude of glacial-interglacial variations, while the combined effect of CO2 decline and regolith removal controls the timing of the transition from a 41,000- to 100,000-year world. Our results suggest that the current CO2 concentration is unprecedented over the past 3 million years ant that global temperature never exceeded the preindustrial value by more than 2°C during the Quaternary.

Another Study Says Europe Was At Times Warmer During The Last Glacial When CO2 Levels Were 40% Lower

by K. Richard, Oct 24, 2022 in NoTricksZone

The Earth was still in ice age conditions 14,700 to 12,900 years ago, or during the “Bolling interstadial.” CO2 hovered near 230 ppm at that time, and yet “continental Europe was a few degrees warmer than present” (Toth et al., 2022).

In recent years there have been multiple studies detailing a European climate that was as warm or warmer than today during the late Pleistocene ice age.

The latest study, Toth et al., 2022, uses chironomid proxy evidence to reconstruct summer temperatures at a lake site in the Eastern Carpathians.

These authors report that “continental Europe was a few degrees warmer than present during the Bolling interstadial,” and there were slightly (0.5°C) warmer-than-today periods (e.g., ~16,300 years ago) at the study site. The warming events were both pronounced (5°C) and abrupt.

LA Times reveals 2020 CA Wildfire CO2 Wiped Out 18 Years of the State’s Emissions Reductions

by L. Hamlin, Oct 22, 2022 in WUWT


The article notes that “researchers estimated that about 127 million metric tons of carbon dioxide equivalent were released by the fires, compared with about 65 million metric tons of reductions achieved in the previous 18 years.”

The Times article provided the usual climate alarmist hype that “climate change” is responsible for the California’s increased wildfire damage noting:

“Forests have long played a role in that system, with large trees sequestering carbon and helping to alleviate some emissions. But California’s new breed of climate-change-fueled fires are burning hotter and faster than those of the past, sometimes slowing the regrowth process and even converting some areas from coniferous trees into grasslands, shrubs and chaparral, the researchers said.”

However a 2021 prior WUWT article addressed the fact that year 2020 wildfire emissions likely wiped out the state AB 32 emissions reductions and also addressed in detail the huge state government forest management failures that have contributed to the states wildfire growth and increasing risks over the past decade with these critical failures hidden from view in the Times article.  This prior WUWT article notes:

“California’s climate alarmists claim “climate change” is responsible for this wildfire outcome but an extensive 2018 California Legislative Analyst Office (LAO) report presents clear and compelling evidence demonstrating that decades of forest mismanagement by the state have in fact created the growing wildfire crisis.

The LAO report notes that increased fire risks are present throughout California driven by forest conditions that have been allowed by the state to develop for decades.”

Provided below are some of the highlights (or lowlights) of the state governments forest management failures that have led directly to increased wildfire growth and risks that have nothing to do with “climate change” as addressed in the states LAO analysis and presented in the prior WUWT article.

Willie Soon on the Tom Nelson Podcast

by C. Rotter, Oct 20, 2022 in WUWT


This CO2 stuff is…pure delusion. You cannot find any signature of that.

Dr. Soon was an astrophysicist at the Solar, Stellar and Planetary Sciences Division of the Harvard-Smithsonian Center for Astrophysics, from 1991-2022. He served as receiving editor for New Astronomy from 2002-2016, astronomer at the Mount Wilson Observatory from 1992-2009. He is also on the editorial board of Geoscience, an MDPI publication since 2020 as well as serving as Review Editor of Frontiers in Earth Science starting 2022. Dr. Soon has also held the role of visiting professors at various institutions including University of Putra, Malaysia, Institute of Earth Environment of Xian, China and State Key Laboratory of Marine Environmental Science at Xiamen University. Since September 2021, Dr. Soon is also affiliated with Hungary’s Institute of Earth Physics and Space Science.
Dr. Soon earned bachelor’s and master’s degrees in science and a Ph.D. in aerospace engineering from the University of Southern California.

“The whole point of science is to question accepted dogmas. For that reason, I respect Willie Soon as a good scientist and a courageous citizen.’’ — Freeman Dyson in the Boston Globe, November 5, 2013

About Willie Soon: https://www.ceres-science.com/willie-soon
103 of his peer-reviewed papers: https://lweb.cfa.harvard.edu/~wsoon/
“How much has the Sun influenced Northern Hemisphere temperature trends? An ongoing debate”: https://iopscience.iop.org/article/10.1088/1674-4527/21/6/131
CERES news: https://www.ceres-science.com/news
Please help support independent science by donating to CERES-science.com:
https://www.ceres-science.com/support-us
——
Tom Nelson’s Twitter: https://twitter.com/tan123
Substack: https://tomn.substack.com/
About Tom: https://tomnelson.blogspot.com/2022/03/about-me-tom-nelson.html
Notes for climate skeptics:
https://tomnelson.blogspot.com/2019/06/useful-notes-for-climate-skeptics.html

he IPCC’s Climate Math Doesn’t Add Up. Will Anyone Notice?

by R. McKitrick, Oct 14, 2022 in ClimateChangeDispatch


The high and rising costs of climate policy — now including the inability of jurisdictions that bet big on renewables to guarantee enough energy for their citizens to survive the coming winter — don’t just entitle us to question the basis for it: they demand we do so.

Ultimately, the justification for renewables is the view that carbon dioxide emissions have a big effect on the climate that will cause devastating harm at some point in the future. [bold, links added]

Scientists measure the effect using a concept called “Equilibrium Climate Sensitivity” or ECS, which estimates how much long-run average warming will occur as a result of doubling the amount of carbon dioxide in the atmosphere.

Some important new evidence pointing to a low ECS value just emerged in the scientific literature.

ECS has long been uncertain. In 1979 the U.S. National Academy of Sciences estimated it to be between 1.5 and 4.5 degrees Celsius, with a best estimate of 3.0 degrees C.

That range, which runs from “no big deal” to “very bad outcomes,” was accepted by the UN Intergovernmental Panel on Climate Change (IPCC) in its first report in 1990 and thereafter until 2007 when, citing greater warming projections in newer models, it raised the bottom end to 2.0 degrees C.

But over the next few years, literature developed using, not model simulations, but observed warming rates since the late-1800s to estimate ECS.

Its results typically centered around 2.0 C or less. So in 2013, the IPCC reduced the bottom end of the range back to 1.5 C and declined to offer a best estimate. In other words, after three decades climate science hadn’t narrowed the uncertainty at all.

The economic implications of ECS being 2 C rather than 3 C are enormous.

There Is No Detectable Link Between Greenland’s Climate And Atmospheric CO2 Changes

by K. Richard, Sep 29, 2022 in NoTricksZone


Greenland’s climate changes are remarkably uncorrelated with climate model expectations and changes in atmospheric CO2.

When CO2 levels were in the mid-200s parts per million (11.7 to 4.5 thousand years ago) the Arctic and northern Greenland were 2-4°C warmer than now, ice margins were 80 km behind today’s, ice-free open water conditions prevailed, and Greenland warmed 10°C in just 60 years (Elnegaard Hansen et al., 2022).


Past interglacial CO2 levels of only 280 ppm were associated with a “nearly ice free” Greenland and the presence of flora and fauna in subarctic terrestrial environments 1000 km northwards of where they can survive today, implying “at least 5°C higher temperatures” (Bennike and Böcher, 2021). Summer sea water temperatures were as much as “7-8°C higher than at present”.

Scientists: The Global Warming Since 1985 Cannot Be Attributed To CO2 Forcing

by K. Richard, Aug 8, 2022 in NoTricksZone


Cloud modulation of shortwave radiation and greenhouse effect forcing has largely been the determining factor in the global warming of the last 45 years. Not CO2.

CO2 forcing and its effect on surface temperatures is detailed in analyses of changes in clear-sky radiation only because all-sky radiation effects that include clouds (and the real-world atmosphere has clouds) overshadow the CO2 impact (Feldman et al., 2015, Harries et al., 2001).

Late 20th Century Climate Forcing

Per satellite observations, from 1985 to 1998 the “background clear-sky OLR [outgoing longwave radiation] was essentially unchanged” (Wang et al., 2002). In other words, any variations in OLR attributed to changes in greenhouse gas concentrations were not detectable.

In contrast, cloud vertical distributions explained 40% of increased tropical outgoing longwave radiation (OLR) and 60% could be explained by the emissivity of clouds, which means OLR changes were “most likely due entirely to changes in tropical cloud characteristics” and “cannot be attributed to increases in greenhouse gas concentrations.”

Furthermore, there was a decrease in reflected shortwave radiation (RSR) of -2.4 W/m² per decade observed from 1985 to 1999, which means there was a +3.6 W/m² increase in solar radiation absorbed by the Earth system during these 14 years. This can easily explain the warming during this period.

..

Updated Atmospheric CO2 Concentration Forecast Through 2050 and Beyond

by R. Spencer, July 18, 2022 in WUWT


Summary

The simple CO2 budget model I introduced in 2019 is updated with the latest Mauna Loa measurements of atmospheric CO2 and with new Energy Information Administration estimates of global CO2 emissions through 2050. The model suggests that atmospheric CO2 will barely double pre-industrial levels by 2100, with a total radiative forcing of the climate system well below the most extreme scenario (RCP8.5) used in alarmist literature (and the U.S. national climate assessment), with the closest match to RCP4.5. The model also clearly show the CO2 reducing effect of the Mt. Pinatubo eruption of 1991.

Greenhouse gas CO2 , should not be feared.

by Dr ir. F. van den Beemt, March 15, 2022 in ScienceTalks


The 2021 UN Climate Change Conference, COP 26, resulted in several countries making statements that they would aim to reduce their emissions of greenhouse gases, particularly CO2, based on the fear that these gases are warming the Earth dangerously by what they call the greenhouse effect. But fear is a bad counselor. Understanding the matter reduces anxiety. The purpose of this article is to inform a broad audience about the greenhouse gas CO2 without going into scientific detail, for the latter see [1].

The Earth Thermostat: ensuring a livable temperature on Earth.

The sun heats the Earth with mostly visible light. Our water planet, the Earth, cools down by invisible heat radiation to space. The Earth’s surface, the oceans, and the atmosphere store heat to varying degrees. Wind- and water flows distribute heat all over the Earth. The evaporation process of water transmits energy from the surface into the air. Warm air rises until it cools and forms clouds. Clouds reflect incoming sunlight back to space that otherwise would have warmed the Earth’s surface. Clouds emit heat radiation to space and also some back to the Earth’s surface. These and many more heat transport processes act together as a planet-wide thermostat to create the livable temperature on Earth that we enjoy today.

The terrestrial thermostat knows no rest.

If the Earth’s surface warms up for any reason, this thermostat acts until a new equilibrium is reached. This equilibrium is never static, however, it fluctuates because the wind, convection, precipitation, and all the other dynamic natural processes continually adjust. The atmosphere shows dynamic, cyclic and chaotic characteristics.


Figure 1 ( copied from Figure 10 in [2]): Effects of changing concentrations of  CO2 on the filtered spectral flux at the mesopause altitude of 86 km. The smooth blue line is the spectral flux, from a surface at the temperature of 288.7 K for a transparent atmosphere with no greenhouse gases. The green line is with the CO2 removed but with all the other greenhouse gases at their standard concentrations. The black line is with all greenhouse gases at their standard concentrations. The red line is for twice the standard concentration of CO2 but with all the other greenhouse gases at their standard concentrations. Doubling the standard concentration of CO2 (from 400 to 800 ppm) would only cause a forcing increase (the area between the black and red lines) of 3.0 W m−2.

Above clouds, the water vapor concentration decreases where CO2 concentration stays nearly constant. Within the upper troposphere and the stratosphere, the CO2-specific part of the emission by clouds and water vapor will be again absorbed but now mainly by CO2. Within the thin stratosphere, CO2 emits to space as our satellites detect.

Heat emission to space at top of the atmosphere

Lennart Bengtsson: Global climate change and its relevance for a global energy policy.

by H. von Storch, March 12, 2013 in DieKlimazwiebel


The relation between temperature and greenhouse gases in its very simplistic form has been known since the second half of the 19thcentury. The effect of the greenhouse gases can be seen as a warm overcoat preventing the surface in radiating away the heat to space. However, the warming is a complex process incorporating the dynamics of atmospheric and ocean flows and interactions of the many components of what is now called the Earth’s system. This includes in addition to the atmosphere, the oceans, the land surfaces and the land ices. Its study requires advanced computer models and other tools for its analysis and understanding.  It also requires accurate observations for validation and monitoring as well as special measurements for the development of many crucial aspects of the models. It is in fact an immensely complex undertaking that is virtually impossible to explain to the public in a readily understandable way. This has lead to a tendency towards oversimplification that has contributed more to confusion than to a thorough understanding. However, because of the strong public interest we are now facing a dilemma as the public and the political community have become too much involved in the climate change debate influencing the actual science and this not necessarily in a positive way as it implies an arbitrary selection of priorities and preferential issues.


Natural processes drive climate and practically all kinds of extreme weather have always been part of the climate and are practically unrelated to the modest warming we so far have had. The effect of increasing greenhouse gases is a slow but relentless process that will have to be dealt with but will require more time and better insight in key processes.Some events are seen as very dramatic as the reduced Arctic summer ice, others, even more puzzling, such as the surprising lack of warming in the tropical troposphere is hardly discussed.

The problem is that the global warming is mainly caused by the emission of carbon dioxide and thus directly related to energy production by fossil fuels that has dominated and still dominates the energy production by more than 80%. To significantly reduce or eliminate fossil fuel is not feasible on a time-scale shorter than several decades, as it requires fundamental technical breakthrough in energy generation or alternatively a major change in our life stile. As the second alternative is hardly possible to achieve in a world with mostly open societies, it is obvious that the world community is facing a gigantic challenge. Additionally many parts of the world are suffering because of a lack of suitable energy and the need is further underpinned by the fact that the world’s population will increase by another two billion humans in the next three decades.

Some comments on the present situation

CO2 and O2 oxidized 2.7 Ga micrometeorites in two stages suggesting a >32% CO2 atmosphere

by Huang G. et al., Nov 2021 in PrecambrianResearch


Abstract
It is widely accepted that atmospheric pO2 < 1 ppm before the Great Oxidation Event. Yet a recent study found fossil micrometeorites (MMs) containing the oxidized iron species wüstite (FeO) and magnetite (Fe3O4) formed 2.7 billion years ago (Ga). How these MMs became oxidized is uncertain. Abundant O2 in the upper atmosphere and iron oxidation by CO2 have been suggested. However, photochemical reactions cannot produce sufficient O2, and oxidation by CO2 can only produce FeO, each individually failing to explain the formation of Fe3O4-only MMs. Using an oxidation model of iron MMs including photochemistry, we show that a >32% CO2 Archean atmosphere and different entry angles can generate the Fe3O4-only and Fe-FeO mixed composition MMs that have been discovered. Oxidation happens in two stages: by CO2 under brief melting, then by O2. Our results challenge existing constraints on Earth’s atmospheric CO2 concentration at 2.7 Ga and support a warm Late Archean despite the ‘faint young Sun’.

New Study Affirms Temperatures Determine Greenhouse Gas Forcing Trends, Not The Other Way Around

by Singh H  & Polvani L, Jun 30, 2022 in NoTricksZone


CO2 and water vapor greenhouse effect impacts are not independent climate forcings . A new study affirms the “variance in the radiance in these channels is primarily controlled by…temperature” and “atmospheric absorption is strongly saturated in these [CO2, water vapor] channels”.

It has previously been established that greenhouse gas (water vapor, CO2) forcing “cannot be considered an independent component of the surface energy budget” because “anomalies in the downward longwave flux at the surface primarily arise as a consequence of surface temperature anomalies, rather than being the cause of those anomalies” (Singh and Polvani, 2020, Zeppetello et al., 2019).

Image Source: Singh and Polvani, 2020, Zeppetello et al., 2019

Feldman et al. (2015) admit they had to “construct” model-based spectra to simulate a CO2 signal in their seminal paper purporting to show CO2 changes cause temperature changes. This is because the temperature and water vapor levels primarily determine the overall longwave forcing (clear-sky) trends.

Radiosonde Temps Show Northern Hemisphere, Tropical Warming Has Mostly Paused Since 1998

by K. Richard, May 22, 2022 in NoTricksZone


A new study indicates nearly all the Northern Hemisphere and Tropical warming in the last 40 years occurred by the late 1990s.

CO2 has risen by about 50 ppm since 1998 (367 to 418 ppm).

Interestingly, upper-air measurements of temperature from balloon-borne sensor radiosonde data, shown below in the image from a new study (Madonna et al., 2022), suggest there was more warming from the early 1980s to late 1990s – when CO2 only rose about 25 ppm (341 to 367 ppm) – than there has been this century.

Radiosonde measurements appear to depict mostly flat temperatures trends since 1998 in both the Northern Hemisphere (25°N to 70°N) and tropics (25°S to 25°N).


….

Image Source: Madonna et al., 2022


Climate Feedback Fact Checks CO2 Coalition

by A. May, Apr 17, 2022 in WUWT


The Climate Feedback website critiques my CO2Coalition article “Attributing global warming to humans.”Their factcheck is here. Like most “fact checks” these days it is a thinly disguised opinion piece. The statement that they claim is incorrect is:

“There is no evidence, other than models, that human CO2 emissions drive climate change and abundant evidence that the Sun, coupled with natural climate cycles, drives most, if not all, of recent climate changes, as described in Connolly, et al., 2021.” [emphasis added]

They cleverly leave out the last phrase: “as described in Connolly, et al., 2021,” and then immediately assert “Solar irradiance has had a negligible impact on Earth’s climate since the industrial era.” This is followed by no evidence other than an appeal to the mythical “consensus.”

Later in the article, they say Connolly, et al. uses simple linear regression to establish a link between solar irradiance and surface temperature. Connolly, et al. does not state that the Sun controls the climate or that humans do, it simply shows that, using available evidence, solar variability (actually TSI, or Total Solar Irradiance variability) could account for anywhere from 0 to 100% of the warming since the Little Ice Age (the so-called “pre-industrial” era). One of the main points of Connolly, et al. is that the IPCC and the so-called “consensus” are ignoring two critical areas of current research. First, they ignore the uncertainty in our estimate of surface warming since the Little Ice Age, and second, they ignore the considerable uncertainty in solar-variability-long-term trends, both recently and since the Little Ice Age. As they state in the paper, the amount of 20th century warming that can be simulated as due to solar variability, depends upon the surface temperature dataset and the solar TSI model used. There are many versions of both. Suffice it to say, while the exact influence of human activities and solar variability on climate change are both unknown, no one can claim solar influence is negligible. The correct answer is we don’t know.

How is the invasion of Ukraine related to carbon dioxide?

by D. Nerbert, Apr 2, 2022 in CO2Coalition


America’s Executive and Legislative Branches are full of ignorant politicians who need help from a 5th-grader. By the 5th grade, students have already learned that all animals and fungi consume oxygen (O2) and release carbon dioxide (CO2);conversely, all plants consume CO2 and expel O2. This is the Circle of Life; without it, our planet would be only a rock in this solar system.

 In 2019 and 2020, America became energy-independent — for the first time since the mid-1950s. This meant greater amounts of crude oil and petroleum products were exported than imported. Our economy was growing beautifully, and unemployment rates were the lowest in more than 50 years. On 20 January 2021, this was abruptly reversed with the stroke of Biden’s pen (executive order 13807 revoked, plus EO13990, EO14008 and EO14030) — which incomprehensibly made America energy-dependent once again, and has also caused this unwanted inflation.

 Biden’s “climate plan” includes goals to transition from fossil fuels to “clean energy,” cut emissions from electric power to zero by 2035, and reach “net-zero CO2 emissions” by 2050. However, “clean energy” (solar and wind) is unreliable and does not even provide 10% of America’s energy needs. Biden’s entire house-of-cards is based on becoming “carbon-neutral” — because CO2 is viewed as “the cause of global warming,” which is claimed to be the “greatest existential threat to mankind.”

 How silly is this? CO2 — along with O2, nitrogen (N2) and water vapor (H2O) — is necessary for all Life on Earth. Geological studies indicate that CO2 levels have been as high as ~10,000-15,000 parts-per-million (ppm). This was during the Cambrian Period (~541 to 485 million years ago), long before mammals existed; at that time, plant life flourished.

 Ice-core data (during the past 800,000 years) have shown cycles of CO2 ranging between ~150-180 ppm during Glacial Periods, and ~280-310 ppm during Inter-Glacial Periods. Earth ascended from its last Glacial Period ~11,500 years ago.

 Warming and cooling oceans are the likely reason for these CO2 oscillations. Atmospheric CO2 has risen from ~280 ppm in 1850 (end of the Little Ice Age) to ~410 ppm today. Thus, current levels of ~410 ppm (i.e., 100 ppm more than 310 ppm) most likely reflect the burning of fossil fuels. However, rising CO2 levels in this last century have substantially improved crop growth.

New Study: The CO2-Drives-Global-Warming ‘Concept’ Is ‘Obsolete And Incorrect’

by K. Richard, Mar 14, 2022 in NoTricksZone


“The IPCC concept that increasing carbon dioxide in the atmosphere causes global warming is three decades out-of-date.”  − Lightfoot and Ratzer (2022), Journal of Basic & Applied Sciences

In analyzing UAH global temperature and Mauna Loa CO2 records from 1979 to 2021, climate researchers Lightfoot and Ratzer (2022) report there has been “little, if any” correlation between these two variables during this period.

They assert that between 91 and 98% of Earth’s greenhouse gas effect is from water vapor, as CO2 and other trace gases contribute less than 5% to greenhouse gas forcing.

A solar minimum has just began in the current solar cycle 25. The declining solar output is projected to eventually lead to a ~1 to 1.2°C cooling over the next 30 to 40 years. Solar minimum periods are also accompanied by crop failures due to frost and weather extremes delivering excessive heat.

The authors conclude by suggesting the popularized conceptualization of CO2 as a driver of global warming has proven to be “obsolete and incorrect”.

Image Source: Lightfoot and Ratzer, 2022