Quelles énergies dans le monde pour 2050 ?

par Prof. Samuel Furfari, 23 Mars 2017

Expert européen auprès de la DG Énergie de la Commission européenne

Maître de conférences à l’Université Libre de Bruxelles


2050, c’est dans 33 ans. Il y a 33 ans, nous étions en 1984, en plein contre-choc pétrolier. Après le tremblement du monde suite aux deux chocs pétroliers consécutifs provoqués par l’OPEP, le prix du pétrole était tombé si bas qu’aujourd’hui encore, tout nouveau contre-choc pétrolier constitue un épouvantail pour l’Arabie saoudite. Qu’est-ce qui avait permis cette contre-révolution et mis en échec la stratégie de l’OPEP ? Tout d’abord, l’abandon de la consommation de produits pétroliers dans les centrales électriques (à l’époque, le prix du brut était si bas que l’on pouvait se permettre le luxe de l’utiliser pour produire de l’électricité). La maturation de la technologie nucléaire et le développement de technologies modernes de combustion de charbon ont changé la donne. Ensuite, la mise en œuvre de technologies plus efficientes, notamment dans le secteur de l’automobile, avait donné lieu à des économies d’énergie qui ont permis de réduire la consommation de pétrole. Cela se résumait à l’époque par un slogan lancé par la Commission européenne : COCONUC pour « COal, COnservation and NUClear ». Les résultats ont été au rendez-vous et ont suscité un retour à la sérénité énergétique.

The State of the Climate in 2016

by Prof. Dr. Ole Humlum, March 22,  2017


A report on the State of the Climate in 2016 which is based exclusively on observations rather than climate models is published today by the Global Warming Policy Foundation (GWPF).

Contents (37 pages)

1. General overview 2016/2. Spatial pattern of global surface air temperatures in 2016/3. Global monthly lower troposphere air temperatures since 1979/4. Global mean annual lower troposphere air temperatures since 1979 ……………………/17. Ocean temperature net change 2004-2016 in two north-south sectors/18. Pacific Decadal Oscillation…………../23. Global, Arctic and Antarctic sea-ice extent/24. Northern hemisphere snow-cover extent and /25 Links to data sources.

Dead zones may threaten coral reefs worldwide

by Smithsonian Tropical Research Institute, March 21, 2017


Dead zones affect dozens of coral reefs around the world and threaten hundreds more according to a new study. Watching a massive coral reef die-off on the Caribbean coast of Panama, they suspected it was caused by a dead zone — a low-oxygen area that snuffs out marine life — rather than by ocean warming or acidification.

Journal Reference: Andrew H. Altieri, Seamus B. Harrison, Janina Seemann, Rachel Collin, Robert J. Diaz, Nancy Knowlton. Tropical dead zones and mass mortalities on coral reefs. Proceedings of the National Academy of Sciences, 2017; 201621517 DOI: 10.1073/pnas.1621517114

Mars volcano, Earth’s dinosaurs went extinct about the same time

by NASA/Goddard Space Flight Center, March 21, 2017


Arsia Mons produced one new lava flow at its summit every 1 to 3 million years during the final peak of activity, about 50 million years ago. The last volcanic activity there ceased about 50 million years ago — around the time of Earth’s Cretaceous-Paleogene extinction, when large numbers of our planet’s plant and animal species (including dinosaurs) went extinct.

Journal Reference:Jacob A. Richardson, James A. Wilson, Charles B. Connor, Jacob E. Bleacher, Koji Kiyosugi. Recurrence rate and magma effusion rate for the latest volcanism on Arsia Mons, Mars. Earth and Planetary Science Letters, 2017; 458: 170 DOI: 10.1016/j.epsl.2016.10.040

THE LONGEST STRETCH OF A BLANK SUN SINCE 2010

by VENCORE WEATHER, March 20, 2017


Third weakest solar cycle since 1755
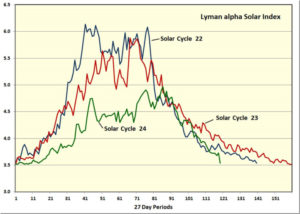
A recent publication has analyzed the current solar cycle and has found that when sunspot anomalies are compared to the mean for the number of months after cycle start, there have been only two weaker cycles since observations began in 1755.  Solar cycle 24 began in 2008 after a historically long and deep solar minimum which puts us more than eight years into the current cycle.

The Logarithmic Effect of Carbon Dioxide

by David Archibald, March 8, 2010


The greenhouse gasses keep the Earth 30° C warmer than it would otherwise be without them in the atmosphere, so instead of the average surface temperature being -15° C, it is 15° C. Carbon dioxide contributes 10% of the effect so that is 3° C. The pre-industrial level of carbon dioxide in the atmosphere was 280 ppm. So roughly, if the heating effect was a linear relationship, each 100 ppm contributes 1° C. With the atmospheric concentration rising by 2 ppm annually, it would go up by 100 ppm every 50 years and we would all fry as per the IPCC predictions.

But the relationship isn’t linear, it is logarithmic. In 2006, Willis Eschenbach posted this graph on Climate Audit showing the logarithmic heating effect of carbon dioxide relative to atmospheric concentration

“No country would find 173 billion barrels of oil in the ground and just leave them there.”

by David Middleton, March 20, 2017


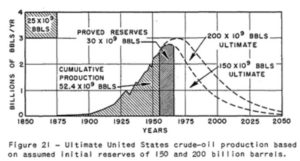
Firstly, the prime minister is exactly correct: “No country would find 173 billion barrels of oil in the ground and just leave them there.” Particularly if those 173 billion barrels were proved reserves.  At $50/bbl, 173 billion barrels is worth a lot of dollars… both US and Canadian.

Secondly, the prime minister is exactly correct here too: “The prime minister has long maintained that developing fossil-fuel resources can go ‘hand in hand’ with fighting climate change.”  Since fighting climate change is about as possible as fighting plate tectonics or entropy, it absolutely “can go ‘hand in hand’ with” developing fossil fuel resources.

Marché du charbon vapeur en 2016 : le choc de l’offre

par Ifri, 20 mars 2017


Après cinq ans de baisse continue, les prix du charbon « vapeur » (type de charbon principalement utilisé dans les centrales thermiques et dans certaines industries, notamment pour fabriquer du ciment) ont doublé entre le début et la fin de l’année 2016, tant en Europe qu’en Asie. La demande mondiale de charbon, qui provient toujours pour moitié de la Chine, a pourtant baissé en 2016.

Modern ‘Warmth’ A Brief Excursion From 8,000-Year (Continuing) Cooling Trend

by Kenneth Richard, March 20, 2017


According to an estimate of global sea surface temperature (SST) changes during the last 2,000 years (“Robust global ocean cooling trend for the pre-industrial Common Era“), the addition of the last 2 centuries (1800 to 2000 C.E.) of relatively modest SST warming only changes the overall per-millennium global cooling trend (~0.4°C) by one tenth of one degree.  In other words, using a long-term perspective, the Holocene cooling trend has continued largely uninterrupted during the last two centuries.

IEA finds CO2 emissions flat for third straight year even as global economy grew in 2016

International Energy Agency, March 17, 2017


The biggest drop came from the United States, where carbon dioxide emissions fell 3%, or 160 million tonnes, while the economy grew by 1.6%. The decline was driven by a surge in shale gas supplies and more attractive renewable power that displaced coal. Emissions in the United States last year were at their lowest level since 1992, a period during which the economy grew by 80%.

The world’s energy needs continue to grow, but many millions are left behind

World Energy Outlook 2016 IEA, March 16, 2017

Executive summary


In our main scenario, a 30% rise in global energy demand to 2040 means an increase in consump on for all modern fuels, but the global aggregates mask a mul tude of diverse trends and signi cant switching between fuels. Moreover, hundreds of millions of people are s ll le in 2040 without basic energy services. Globally, renewable energy – the subject of an in-depth focus in WEO-2016 – sees by far the fastest growth. Natural gas fares best among the fossil fuels, with consump on rising by 50%. Growth in oil demand slows over the projec on period, but tops 103 million barrels per day (mb/d) by 2040. Coal use is hit hard by environmental concerns and, a er the rapid expansion of recent years, growth essen ally grinds to a halt. The increase in nuclear output is spurred mainly by deployment in China.

Ice age thermostat prevented extreme climate cooling

Universitat Autònoma de Barcelona, March 14, 2017
from E. D. Galbraith, S. EgglestonA lower limit to atmospheric CO2 concentrations over the past 800,000 yearsNature Geoscience, 2017


During the ice ages, an unidentified regulatory mechanism prevented atmospheric carbon dioxide concentrations from falling below a level that could have led to runaway cooling, reports a team of researchers. The study suggests the mechanism may have involved the biosphere, as plants and plankton struggled to grow under very low carbon dioxide levels.

The second shale revolution

by Nick Butler, March 13, 2017


After the dip last year, production of oil from shale rocks in the US is increasing again. Estimates for this year range from a net increase of between 400,000 and 800,000 b/d. And 2017 is not a one-off year. The Permian Basin in Texas — the main focus for the new activity — has oil reserves that exceed those of all the largest discovered fields globally, such as Ghawar in Saudi Arabia and Prudhoe Bay in Alaska

Oil below $50: OPEC’s production cap plan is backfiring as U.S. shale enters ‘near nirvana’

by Jesse Snyder, March 10, 2017


Vicky Hollub, the CEO of Occidental Petroleum Corp., speculated that Permian production could in coming years reach as high as four or five million barrels per day, up from around 2.2 million bpd today.

A confluence of factors has created “near nirvana” for the U.S. shale industry, analysts at Citi Group said in a recent research note. Among those factors was the OPEC-led agreement to curb oil supplies in an attempt to lift prices.

Country Analysis Brief: Australia

by U.S. Energy Information Administration, update March 7, 2017


Australia, rich in hydrocarbons and uranium resources, was the world’s largest coal exporter in 2015 and the second-largest liquefied natural gas (LNG) exporter in 2015.

Australia is rich in commodities, including fossil fuel and uranium reserves, and is one of the few countries belonging to the Organization for Economic Cooperation and Development (OECD) that is a significant net energy exporter. Australia sent about 68% of its total energy production (includes uranium exports and excludes total energy imports) overseas in fiscal year 2015 (July 2014—June 2015), according to data from the Australian government

Interview : les sables bitumineux au Canada

par Peter Budgell, 12 février 2016


Si le Canada est le 5e producteur mondial de pétrole (derrière les États-Unis, l’Arabie saoudite, la Russie et la Chine), il le doit à ses gisements de sables bitumineux qui le placent au 3e rang en matière de réserves prouvées (derrière le Venezuela et l’Arabie saoudite). Face à la chute des cours du brut, l’Alberta est toutefois en difficultés et le Premier ministre canadien Justin Trudeau a récemment annoncé une aide financière pour relancer l’économie de cette province pétrolière. Les sables bitumineux sont d’autre part montrés du doigt en raison de leur impact environnemental. Quel sera l’avenir de ces ressources ?

Egalement : les ressources naturelles sont-elles inépuisables?

California Megaflood: Lessons from a Forgotten Catastrophe

by B. Lynn Ingram, January 1, 2013


 43-day storm that began in December 1861 put central and southern California underwater for up to six months, and it could happen again

Geologic evidence shows that truly massive floods, caused by rainfall alone, have occurred in California every 100 to 200 years. Such floods are likely caused by atmospheric rivers: narrow bands of water vapor about a mile above the ocean that extend for thousands of kilometers.

Vision, not limbs, led fish onto land 385 million years ago

through ScienceDaily, March 7, 2017

A new study suggests it was the power of the eyes and not the limbs that first led our aquatic ancestors to make the leap from water to land. The researchers discovered that eyes nearly tripled in size before — not after — the water-to-land transition. Crocodile-like animals saw easy meals on land and then evolved limbs that enabled them to get there, the researchers argue.

Timing of global regression and microbial bloom linked with the Permian-Triassic boundary mass extinction: implications for driving mechanisms

by Björn Baresel et al., March 6, 2017, Nature


Since the early days of stratigraphy, mass extinctions were noticed to coincide with major and global sea-level changes1,2 that significantly alter extinction patterns and time-series of geochemical proxies. In the case of the Permian-Triassic boundary mass extinction (PTBME), the system boundary itself has been initially placed during a global eustatic regression3, but was subsequently placed during a global transgression4 …

Shock finding : P-T mass extinction was due to an ice age, and not to warming

Geologic Evidence of Recurring Climate Cycles and Their Implications for the Cause of Global Climate Changes. The Past is the Key to the Future

Don J. Easterbrook, 2011

Department of Geology, Western Washington University, Bellingham, WA 98225, USA


Temperatures have risen approximately a degree or so per century since the coldest part of the Little Ice Age ~500 years ago, but the rise has not been linear. Global temperatures have warmed and cooled many times in 25-35-year cycles, well before the atmospheric CO2 began to rise significantly.

Two episodes of global warming and two episodes of global cooling occurred during the 20th century (Fig. 1). Overall, temperatures during the century rose about the same as the rate of warming per century since the Little Ice Age 500 years ago.

World’s oldest fossils unearthed

by University College London, March 1, 2017


Remains of microorganisms at least 3,770 million years old have been discovered by an international team led by UCL scientists, providing direct evidence of one of the oldest life forms on Earth.

Tiny filaments and tubes formed by bacteria that lived on iron were found encased in quartz layers in the Nuvvuagittuq Supracrustal Belt (NSB), Quebec, Canada.

The NSB contains some of the oldest sedimentary rocks known on Earth which likely formed part of an iron-rich deep-sea hydrothermal vent system that provided a habitat for Earth’s first life forms between 3,770 and 4,300 million years ago …

La géologie, une science plus que passionnante … et diverse