by Climate4you, April 2019
All diagrams in this report, along with any supplementary information, including links to data sources and previous issues of this newsletter, are freely available for download on www.climate4you.com
Yours sincerely,
Ole Humlum (Ole.Humlum@gmail.com)
Arctic Historical Evaluation and Research Organisation, Longyearbyen, Svalbard April 19, 2019.
by Javier, April 23, 2019 in WUWT
I have maintained since 2015 that in the 2006-2007 season the Arctic underwent a cyclical phase shift, and the rapid sea-ice melting observed over the previous decades ended. A few scientists predicted or explained this shift based on their study of multi-decadal oscillations (see bibliography). They were ignored by mainstream climatology and the press because the “anthropogenic” melting of the Arctic is one of the main selling points of the climate scare. See for example:
…
Year after year the data supports my view over the desperate scaremongers like Tamino. With the passing of time it is more and more difficult to defend the idea that Arctic melting is continuing, so alarmists keep changing the metric. First it was September sea-ice extent (SIE), then September sea-ice volume, and now annual average SIE. However, the reference measurements are September minimum SIE and March maximum SIE.
This article is more than a biannual update on the Arctic ice situation, as I will focus specifically on showing evidence for the trend change that took place in 2007. As 12 years have passed since the shift, the best way is to compare the 2007-2019 period with the previous 1994-2006 period of equal length to display the striking differences between both periods.
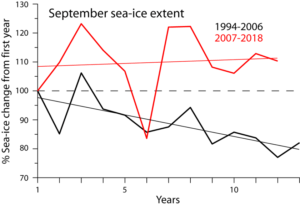
Figure 1. Changes in September SIE for both periods as a percentage change over the first year of the period.
…
by David Middleton, April 16, 2019 in WUWT
In part one of this series, we looked at Peak Oil and its irrelevance to energy production. In Part Deux, we will look at “abiotic oil,” a real(ish) thing that really doesn’t matter outside of academic discussions and SyFy blogs.
A note on terminology
Some refer to this as “abiogenic oil.” This is not a useful term because all oil is abiogenic. The generally accepted theory of petroleum formation doesn’t state that it is a biogenic process. I discussed this in detail in a 2017 post. I don’t intend to restate it here.
In this post, “abiotic oil” refers to petroleum formed by processes that do not rely on biological source material. The carbon in “abiotic oil” must be inorganic.
A real example of abiotic “oil”
The Lost City Hydrothermal Field is located on the Mid-Atlantic Ridge, about 15 km (~9 mi) west of the spreading center, in water depths ranging from 750-900 m (~2,500-3,000′) (Kelley et al., 2005).

Figure 1. Lost City location map. (University of Washington)
…
by Zherebtsov G.A. et al., April 2019 in J.Atm&SolarTerrestrialPhysics
Abstract
We discuss the issues of primary importance to understand the nature of climate changes in the 20th century and main physical processes responsible for these changes and present a physical model for the solar activity (SA) effect on climate characteristics. A key concept of this model is the heliogeophysical disturbance effect on the Earth climate system parameters driving the long-wave radiation flux moving away from the Earth out into space in high-latitude regions. We address the solar activity effect on the changes in the temperature of the atmosphere and of the World Ocean. The aa–index of the geomagnetic activity (GA) was used as an SA proxy index. We discuss the results of analyzing the regularities and peculiarities of the tropospheric and sea surface temperature (SST) responses to both separate heliogeophysical disturbances and long-term changes in solar and geomagnetic activity. The structure of the tropospheric and SST temperature responses was shown to feature a spatial time irregularity. We revealed the regions, where long-term SST changes are determined mainly by SA variations.
…
La géologie, une science plus que passionnante … et diverse
