Full-time professor at the Free University of Brussels, Belgium
apreat@gmail.com
apreat@ulb.ac.be
• Department of Earth Sciences and Environment
Res. Grp. - Biogeochemistry & Modeling of the Earth System
Sedimentology & Basin Analysis
• Alumnus, Collège des Alumni, Académie Royale de Sciences, des Lettres et des Beaux Arts de Belgique (mars 2013). http://www.academieroyale.be/cgi?usr=2a8crwkksq&lg=fr&pag=858&rec=0&frm=0&par=aybabtu&id=4471&flux=8365323
• Prof. Invited, Université de Mons-Hainaut (2010-present-day)
• Prof. Coordinator and invited to the Royal Academy of Sciences of Belgium (Belgian College) (2009-
present day)
• Prof. partim to the DEA (third cycle) led by the University of Lille (9 universities from 1999 to 2004) - Prof. partim at the University of Paris-Sud/Orsay, European-Socrates Agreement (1995-1998)
• Prof. partim at the University of Louvain, Convention ULB-UCL (1993-2000)
• Since 2015 : Member of Comité éditorial de la Revue Géologie de la France http://geolfrance.brgm.fr
• Since 2014 : Regular author of texts for ‘la Revue Science et Pseudosciences’ http://www.pseudo-sciences.org/
• Many field works (several weeks to 2 months) (Meso- and Paleozoic carbonates, Paleo- to Neoproterozoic carbonates) in Europe, USA (Nevada), Papouasia (Holocene), North Africa (Algeria, Morrocco, Tunisia), West Africa (Gabon, DRC, Congo-Brazzaville, South Africa, Angola), Iraq... Recently : field works (3 to 5 weeks) Congo- Brazzaville 2012, 2015, 2016 (carbonate Neoproterozoic).
Degree in geological sciences at the Free University of Brussels (ULB) in 1974, I went to Algeria for two years teaching mining geology at the University of Constantine. Back in Belgium I worked for two years as an expert for the EEC (European Commission), first on the prospecting of Pb and Zn in carbonate environments, then the uranium exploration in Belgium. Then Assistant at ULB, Department of Geology I got the degree of Doctor of Sciences (Geology) in 1985. My thesis, devoted to the study of the Devonian carbonate sedimentology of northern France and southern Belgium, comprised a significant portion of field work whose interpretation and synthesis conducted to the establishment of model of carbonate platforms and ramps with reefal constructions.
I then worked for Petrofina SA and shared a little more than two years in Angola as Director of the Research Laboratory of this oil company. The lab included 22 people (micropaleontology, sedimentology, petrophysics). My main activity was to interpret facies reservoirs from drillings in the Cretaceous, sometimes in the Tertiary. I carried out many studies for oil companies operating in this country.
I returned to the ULB in 1988 as First Assistant and was appointed Professor in 1990. I carried out various missions for mining companies in Belgium and oil companies abroad and continued research, particularly through projects of the Scientific Research National Funds (FNRS).
My research still concerns sedimentology, geochemistry and diagenesis of carbonate rocks which leads me to travel many countries in Europe or outside Europe, North Africa, Papua New Guinea and the USA, to conduct field missions.
Since the late 90's, I expanded my field of research in addressing the problem of mass extinctions of organisms from the Upper Devonian series across Euramerica (from North America to Poland) and I also specialized in microbiological and geochemical analyses of ancient carbonate series developing a sustained collaboration with biologists of my university. We are at the origin of a paleoecological model based on the presence of iron-bacterial microfossils, which led me to travel many countries in Europe and North Africa. This model accounts for the red pigmentation of many marble and ornamental stones used in the world. This research also has implications on the emergence of Life from the earliest stages of formation of Earth, as well as in the field of exobiology or extraterrestrial life ...
More recently I invested in the study from the Precambrian series of Gabon and Congo. These works with colleagues from BRGM (Orléans) are as much about the academic side (consequences of the appearance of oxygen in the Paleoproterozoic and study of Neoproterozoic glaciations) that the potential applications in reservoir rocks and source rocks of oil (in collaboration with oil companies).
Finally I recently established a close collaboration with the Royal Institute of Natural Sciences of Belgium to study the susceptibility magnetic signal from various European Paleozoic series. All these works allowed me to gain a thorough understanding of carbonate rocks (petrology, micropaleontology, geobiology, geochemistry, sequence stratigraphy, diagenesis) as well in Precambrian (2.2 Ga and 0.6 Ga), Paleozoic (from Silurian to Carboniferous) and Mesozoic (Jurassic and Cretaceous) rocks. Recently (2010) I have established a collaboration with Iraqi Kurdistan as part of a government program to boost scientific research in this country.
My research led me to publish about 180 papers in international and national journals and presented more than 170 conference papers. I am a holder of eight courses at the ULB (5 mandatory and 3 optional), excursions and field stages, I taught at the third cycle in several French universities and led or co-managed a score of 20 Doctoral (PhD) and Post-doctoral theses and has been the promotor of more than 50 Masters theses.
by Alex Nussbaum, February 23, 2018 in BloombergNews
Cube development,’ which taps multiple layers of shale all at once, could accelerate the U.S. shale boom and make the global supply glut even worse.
In the scrublands of West Texas there’s an oil-drilling operation like few that have come before.
Encana Corp.’s RAB Davidson well pad is so mammoth, the explorer speaks of it in military terms, describing its efforts here as an occupation. More than 1 million pounds of drilling rigs, bulldozers, tanker trucks and other equipment spread out over a dusty 16-acre expanse. As of November, the 19 wells here collectively pumped almost 20,000 barrels of crude per day, according to company reports.
Firstly let me say that I am not one of the most technical writers you will see here. I regard myself pretty much as a layman despite studying Geology, Mathematics and Computer Science at University.
So you won’t find all the references to papers (well not many), nor exact scientific formulae. I simply write what I have logically deduced. For any who disagree, or have value to add, please use the Comments below.
Researchers have provided new insights into how molten rock (magma) moves through the Earth’s crust to feed volcanic eruptions. Using laboratory experiments involving water, jelly and laser imaging, researchers were able to demonstrate how magma magma flows through the Earth’s crust to the surface through magma-filled cracks called dykes.
How cities heat up The way streets and buildings are arranged makes a big difference in how heat builds up, study shows
CAMBRIDGE, Mass. – The arrangement of a city’s streets and buildings plays a crucial role in the local urban heat island effect, which causes cities to be hotter than their surroundings, researchers have found. The new finding could provide city planners and officials with new ways to influence those effects.
Some cities, such as New York and Chicago, are laid out on a precise grid, like the atoms in a crystal, while others such as Boston or London are arranged more chaotically, like the disordered atoms in a liquid or glass. The researchers found that the “crystalline” cities had a far greater buildup of heat compared to their surroundings than did the “glass-like” ones.
A vicious cold blast is about to invade Europe from the Russian Front and shock freeze the continent.
Interestingly some people – meteorologists among them – have been poking fun at the “hype” or even have blasted media outlets and other private meteorologists for “sensationalizing” the forecast Cold Beast from the East.
Sure, a number of locations over Germany for example may not even see temperatures drop below -10°C. What’s the big deal? It’s winter after all, they are saying. Just put on an extra coat. Some of these critics have even called the loud warnings of the Siberian cold “shrill, dumbass, click-baiting headlines“.
by Benny Peiser, February 23, 2018 in ClimateChangeDispatch
Ørsted must repair up to 2,000 wind turbine blades because the leading edge of the blades has become worn down after just a few years at sea.
Siemens Gamesa also does not want to comment on the costs, but the company’s Danish subsidiary has just provided 4.5 billion Danish Krone ($750 million) or 16% of its revenue to guarantee its commitments (…)
According to the United Nations Intergovernmental Panel on Climate Change (UN-IPCC) and computer modeling, the Sun’s role in modern-era climate change checks in at somewhere slightly above nothing.
And yet it is increasingly evident that more and more scientists across the globe do not take the position that the Sun’s influence on climate change is negligible.
In 2016 and 2017, for example, over 250 papers (see here and here) linking the Sun to climate changes were published in scientific journals.
by P. Homewood, February 22, 2018 in NotaLotofPeopleKnowThat
These are the highlights:
The speed of the energy transition is uncertain and the new Outlook considers a range of scenarios. Its evolving transition (ET) scenario, which assumes that government policies, technologies and societal preferences evolve in a manner and speed similar to the recent past, expects
The long term forecast for Europe, where it is already colder than normal, shows temperatures plummeting to near -20°C in parts of Central Europe by early next week, extending what has been already a brutal winter.
Europeans longing for spring will just have to be patient for awhile. Indeed this winter has been a harsh one across the northern hemisphere with record cold temperatures being set from Siberia to North America to Japan. Also a number of places have seen record snowfalls.
The European Alps have had one of the snowiest winters in years as snow continues to pile up meters high.
The bizarre issue of climate catastrophism has been around suf ciently long that it has become possible to trace its history in detail, and, indeed, several excellent re- cent books do this, placing the issue in the context of a variety of environmental, economic and political trends.
by P. Homewood, February 21, 2018 in NotaLotofPeopleKnowThat
The Arctic Ocean once froze reliably every year. Those days are over.
Arctic sea ice extent has been measured by satellites since the 1970s. And scientists can sample ice cores, permafrost records, and tree rings to make some assumptions about the sea ice extent going back 1,500 years. And when you put that all on a chart, well, it looks a little scary (…)
From the EUROPEAN COMMISSION JOINT RESEARCH CENTRE and the “Dr. Roger Pielke Sr. was right” department. I suspect a whole bunch of climate models that don’t take this into consideration, and think CO2 is the dominant climate driver, are going to need to be revised.
Land use change has warmed the Earth’s surface
Natural ecosystems play a crucial role in helping combat climate change, air pollution and soil erosion. A new study by a team of researchers from the Joint Research Centre, the European Commission’s science and knowledge service, sheds light on another, less well-known aspect of how these ecosystems, and forests in particular, can protect our planet against global warming.
by Bjorn Lomborg, February 20, 2018 in ClimateChangeDispatch
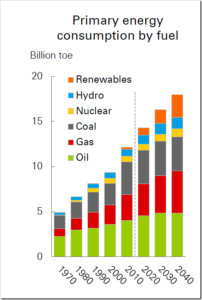
The world is mostly run on fossil fuels (81%). Nuclear makes up 5%, with 14% from renewables. Solar panels and wind turbines contribute 0.8%.
When you hear 14% renewables, you will likely think ‘wow, things are going pretty well with the switch to renewables’. But these renewables are not the ones you hear about. The biggest contributor is humanity’s oldest fuel: wood (…)
A new study on the timescale of plant evolution has concluded that the first plants to colonize the Earth originated around 500 million years ago — 100 million years earlier than previously thought.
For the first four billion years of Earth’s history, our planet’s continents would have been devoid of all life except microbes.
From Keele University and the “It’s like deja vu all over again” department with the leader of the “ship of fools” thrown in for comic relief. Long-time WUWT readers surely remember the single “Most influential tree in the world” from the Yamal fiasco, where the “signal” in one tree (YAD06) biased an entire paper with a hockey stick shape, making it worthless. Well, here we are again with another single tree used to define the entire globe. Obviously they’ve learned nothing, then again, it’s Chris Turney.
In popular culture, asteroids play the role of apocalyptic threat, get blamed for wiping out the dinosaurs — and offer an extraterrestrial source for mineral mining. But for one researcher, asteroids play an entirely different role: that of time capsules showing what molecules originally existed in our solar system. Having that information gives scientists the starting point they need to reconstruct the complex pathway that got life started on Earth.
Earlier this month, the authors of a new paper (Partridge et al., 2018) published in Geophysical Research Letters promulgated the term “warming hole” to describe the cooling temperatures gripping most of the Eastern half of the United States from the late 1950s through 2015
I missed this report at the time, but it is a comprehensive account of how large scale adjustments of temperatures have made global temperature datasets virtually worthless. (…)
by Eck, February 15, 2018 in K. Richard NoTricksZone
A new scientific study says surface temperatures in the Northeastern U.S. (Appalachian Mountains) have undergone a significant long-term cooling trend since the early 20th century, complicating the detection of a clear anthropogenic global warming (AGW) signal for the region.
According to Eck (2018), the two coldest Appalachian winters since 1910 were recorded in recent years (2009-’10 and 2010-’11), and 9 of the 10 warmest winters occurred prior to 1960.
In the early 1930s, Appalachian winters were 4.7°C warmer than they have been during the last 30 years (1987-2017).
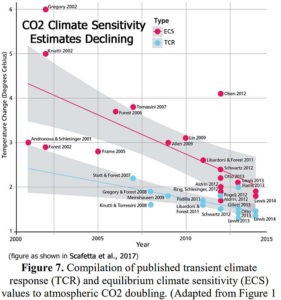
A recently highlighted paper published by atmospheric scientists Scafetta et al., (2017) featured a graph (above) documenting post-2000 trends in the published estimates of the Earth’s climate sensitivity to a doubling of CO2 concentrations (from 280 parts per million to 560 ppm).
Prologue: I have been writing recently about Sea Level Rise, both as particular local examples ( Guam, Canton, Miami, New York, and NY/NJ ) and in the series SEA LEVEL: Rise and Fall, of which this is the fourth-plus installment.
When the seabed loses its stability and starts to move, it often happens in much larger dimensions than landslides ashore — and at slopes with very low gradients. At the same time, discplacement of large amounts of sediment under water scan cause devastating tsunamis. However, why and when submarine landslides develop is hardly understood. Marine scientists have now published possible causes based on observations on submarine landslides off the coast of northwest Africa.
GEOMAR researchers find links between sedimentation and methane seeps on the seafloor off the coast of Norway
Large amounts of the greenhouse gas methane are locked up as solid gas hydrates in the continental slopes of ocean margins. Their stability depends on low temperatures and high pressure. However, other factors that influence gas hydrate stability are not as well understood. A German-Norwegian research team has found evidence off the coast of Norway that the amount of sediment deposited on the seafloor can play a crucial role. The study has been published today in the international journal Nature Communications.
La géologie, une science plus que passionnante … et diverse