A few years ago, 10 glaciologists publishing in the journal Nature Geoscience asserted that “large parts of the north-central Greenland ice sheet are melting from below” due to high geothermal heat flux forcing (Rogozhina et al., 2016).
In a new paper published in Scientific Reports, 4 more glaciologists (Rysgaardet al., 2018) report that “hot vents” (or hot springs) of geothermally-heated water underneath the Greenland ice sheet can explain localized rising temperatures and glacial melting.
The researchers published their findings this week in the Proceedings of the National Academy of Sciences.
Scientists frequently look to the Eocene to understand how the Earth responds to higher levels of carbon dioxide. During the Eocene, the concentration of carbon dioxide in the atmosphere was more than 560 parts per million, at least twice preindustrial levels, and the epoch kicked off with a global average temperature more than 8 degrees Celsius – about 14 degrees Fahrenheit – warmer than today, gradually cooling over the next 22 million years. These characteristics make the Eocene a good period on which to test our understanding of the climate system, said Laura Cotton, study co-author and curator of micropaleontology at the Florida Museum of Natural History.
Ce numéro spécial de la revue “Arguments” est dédié à la mémoire d’István Markó, professeur à l’UCL, décédé inopinément en août 2017. Au cours des dix dernières années cet éminent scientifique a consacré toute son énergie et utilisé ses très grandes compétences à l’analyse des données expérimentales et théoriques concernant l’évolution du climat pour arriver à la conclusion que la théorie du réchauffement climatique d’origine anthropique était non fondée. Toute cette théorie aux conséquences politiques, économiques et sociales gigantesques repose sur une seule et fragile hypothèse : le CO2 renverrait vers la Terre une partie du rayonnement qui devrait s’échapper vers le vide interplanétaire et il en résulterait une élévation de température. Or, il n’existe aucune preuve scientifique liant un réchauffement climatique à une augmentation de la teneur en CO2 dans l’atmosphère.
Equilibrium climate sensitivity (ECS) remains one of the most important unknowns in climate change science. ECS is defined as the global mean warming that would occur if the atmospheric carbon dioxide (CO2) concentration were instantly doubled and the climate were then brought to equilibrium with that new level of CO2.
(…)
This metric of variability can also be calculated from observational records of global warming3, which enables tighter constraints to be placed on ECS, reducing the probability of ECS being less than 1.5 degrees Celsius to less than 3 per cent, and the probability of ECS exceeding 4.5 degrees Celsius to less than 1 per cent.
Well, my old index to my posts was out of date, and I finally got tired of not being able to find things that I’ve written. This is me trying to figure it out.
So I wrote a program in the computer language “R”. It takes as input a list of URLs of my writings, and it goes and scrapes each post. As output it gives me the name of the post, the category if any, and the first few lines of text.
The short answer to the question posed in the title to this article is virtually and practically nothing. They definitely do not tell us what is claimed, that is, accurate representation of the state of the atmosphere including temperature in individual years. This is why one of the world’s experts on atmospheric chemistry and ice cores Zbigniew Jaworowski M.D., Ph.D., D.Sc., wrote,
“It was never experimentally demonstrated that ice core records reliably represent the original atmospheric composition.”
In Germany there is one weather station that has be intact and unchanged for some 138 years.
It has never been moved and never been corrupted by the urban heat island (UHI) effect. Moreover it has consistently used the same instrumentation and computation method over the entire period, thus making it rare indeed. Few station can boast having those instrumentation qualities.
by P. Homewood, January 18, 2018 in NotaLotofPeopleKnowThat
The topic of how the US temperature record has been massively altered in recent years has been well covered by Tony Heller, myself and others in the past.
We report a previously-unexplored natural temperature cycle recorded in ice cores from Antarctica—the Antarctic Centennial Oscillation (ACO)—that has oscillated for at least the last 226 millennia. Here we document the properties of the ACO and provide an initial assessment of its role in global climate.
There is a new way to measure the average temperature of the ocean thanks to researchers at Scripps Institution of Oceanography at the University of California San Diego. In an article published in the Jan. 4, 2018, issue of the journal Nature, geoscientist Jeff Severinghaus and colleagues at Scripps Oceanography and institutions in Switzerland and Japan detailed their ground-breaking approach.
Princeton University researchers have found that the climate models scientists use to project future conditions on our planet underestimate the cooling effect that clouds have on a daily — and even hourly — basis, particularly over land.
The researchers report in the journal Nature Communications Dec. 22 that models tend to factor in too much of the sun’s daily heat, which results in warmer, drier conditions than might actually occur. The researchers found that inaccuracies in accounting for the diurnal, or daily, cloud cycle did not seem to invalidate climate projections, but they did increase the margin of error for a crucial tool scientists use to understand how climate change will affect us.
It is clear that 2017 was a very warm year. Tomorrow, NOAA, NASA and the UK Met Office will announce by how much. It won’t be a record-breaker, but it will be in the top five, and that has already started comments about why it has been so hot. After all, the record-setting El Niño temperatures of the 2015-16 are over – so why did it remain so hot? The reason, according to some, is clear: the resurgence of global warming. The year 2017 is the hottest non-El Niño year ever and therefore signifies a dramatic increase of global warming after 20-years or so when the global temperature hasn’t done very much.
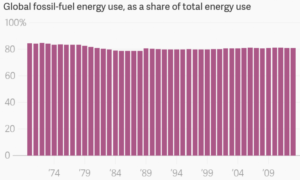
Quartz.com here presents an interesting chart which tells us the green energy revolution of the past 30 years has resulted in practically nothing. It’s been a flop. Fossil fuels remain as wildly popular as ever.
The 2014-2017 El Nino “warm blob” was likely created, maintained, and partially recharged on two separate occasions by massive pulses of super-heated and chemically charged seawater from deep-sea geological features in the western North Pacific Ocean. This strongly supports the theory all El Ninos are naturally occurring and geological in origin. Climate change / global warming had nothing to do with generating, rewarming, intensifying, or increasing the frequency of the 2014-2017 El Nino or any previous El Nino.
If proven correct, this would revolutionize climatology and key aspects of many interrelated sciences such as oceanography, marine biology, glaciology, biogeochemistry, and most importantly meteorology. Information supporting a geological origin of El Ninos is diverse, reliable, and can be placed into five general categories as follows: (…)
by Ron Clutz, January 12, 2010 in ClimateChangeDispatch
The Pomeroy essay focuses on theories in the field of psychology and describes stages through which they rise, become accepted, challenged and discarded.
It has long seemed to me that global warming/climate change theory properly belongs in the field of social studies and thus should demonstrate a similar cycle.
Summary: Here are brief excerpts and my comments from a speech by an eminent climate scientist. It illuminates important aspects about one of the great public policy debates of our time. He was speaking candidly to his peers, but we can also learn much from it.
“Some Thoughts from a Reluctant Participant”
Presentation by Richard Alley.
At the Forum on Transforming Communication in the Weather, Water, and Climate Enterprise — Focusing on Challenges Facing Our Sciences.
Given at the 2018 Annual Conference of the American Meteorological Society, 7 January 2018.
by Tony Heller, January 11, 2018 in TheDeplorableClimSciBlog
Afternoon temperatures during the first week of January have been declining in the US for a century, and have dropped more than ten degrees during the last decade.
Princeton University researchers have found that the climate models scientists use to project future conditions on our planet underestimate the cooling effect that clouds have on a daily — and even hourly — basis, particularly over land.
The researchers report in the journal Nature Communications Dec. 22 that models tend to factor in too much of the sun’s daily heat, which results in warmer, drier conditions than might actually occur. The researchers found that inaccuracies in accounting for the diurnal, or daily, cloud cycle did not seem to invalidate climate projections, but they did increase the margin of error for a crucial tool scientists use to understand how climate change will affect us.
SPOTLIGHT: We’re told that the Intergovernmental Panel on Climate Change (IPCC) is a scientific organization that makes scientific determinations. But that isn’t true.
Prologue: I have been writing recently about Sea Level Rise, both as particular local examples ( Guam, Canton, Miami, New York, and NY/NJ ) and in the series SEA LEVEL: Rise and Fall, of which this is the fourth installment.
Series Take Home Messages:
Overall, the seas have been rising, slowly and inexorably, since the end of the last Ice Age, with some blips and bumps along the way. In general, they will continue to do so for the foreseeable future — at somewhere between 4-12 inches [10-30cm] per century. This rate is an imminent threat to populated areas built nominally at today’s existing sea level.
Science is hard. Some easy problems you can solve by hard work, if you are in the right place at the right time and have the right skills. Hard problems take the combined effort of multiple groups looking at the problem, publishing results and finding fault with eachother’s work, until hopefully no-one can find any more problems. When problems are hard, you may have to publish something that even you don’t think is right, but that might advance the discussion.
The calculation of an unbiased sea surface temperature record is a hard problem. Historical sea surface temperature observations come from a variety of sources, with early records being measured using wooden, canvas or rubber buckets (figure 1), later readings being taken from engine room intakes or hull sensors, and the most recent data coming from drifting buoys and from satellites.
A new study published Jan. 8 in the journal Nature Geoscience reveals that strong El Nino events can cause significant ice loss in some Antarctic ice shelves while the opposite may occur during strong La Nina events.