By Dr. Sebastian Lüning and Prof. Fritz Vahrenholt
(German text translated/edited by P. Gosselin)
This month two major North Sea storms have hit Europe rather severely, and not surprisingly the usual climate ambulance chasers were out in force to try to pin the blame on man’s activity, and in doing so ignored the climate history that provides us with the proper perspective. We look at some analyses of past German storm activity.
Les scientifiques en déduisent que le réchauffement global actuel pourrait potentiellement être “sans précédent” sur les 100 derniers millions d’années. L’étude de ces géochimistes, publiée dans Nature Communications, constitue une sorte de pavé dans la mare des paléoclimatologues qui utilisent depuis les années 1950 ce “paléothermomètre” aidant à bâtir les modèles actuels sur le réchauffement climatique
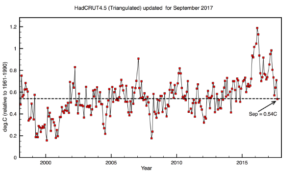
The HadCRUT4.5 temperature anomaly for September calculated by spherical triangulation is 0.54C, a fall of 0.17C since August. Temperatures have seemingly returned to a long trend after the 2016 El Nino.
Here, for the first time in public, is Javier’s entire collection of massive, “consensus” climate science prediction failures. This collection is carefully selected from only academics or high-ranking officials, as reported in the press or scientific journals. Rather than being exhaustive, this is a list of fully referenced arguments that shows that consensus climate science usually gets things wrong, and thus their predictions cannot be trusted.
by Ron Clutz, October 30, 2017 in ClimateChangeDispatch
Extents expanded rapidly during the last 12 days of October through yesterday, especially on the Eurasian side. At the top center the Laptev Sea fills in completely, and to the left East Siberian Sea is also growing solid ice toward East Asia. Kara sea on the right is growing fast ice from the shore outward, while the Barents Sea fills in from the central Arctic.
This interview was published by Breitbart News Network, in an edited version, on 28 October 2017. Here is the complete version.
István Markó (1956 – 2017) was a professor and researcher in organic chemistry at the Université catholique de Louvain. Prof. Dr. Marko was an outspoken defender of the skeptical view on the issue of human-caused/anthropogenic global warming, appearing in numerous French-language media on the Internet, in public debates and diverse English-language blog postings. He also joined with Anglo-Saxon climate skeptics, publishing several articles together on Breitbart News.
September Sea Surface Temperatures (SSTs) are now available, and we see downward spikes in ocean temps everywhere, led by sharp decreases in the Tropics and SH, reversing the bump upward last month. The Tropical cooling in particular factors into forecasters favoring an unusually late La Nina appearance in coming months.
As promised, I attended Al Gore’s climate change lecture at Rice University last night. Rice University is one of the most beautiful university campuses I’ve ever seen, so it was a delight to see it again. The architecture is outstanding, and the buildings are placed in a garden-like setting. It was lovely to walk from the parking lot to the fieldhouse. The speech was held in a packed Tudor Fieldhouse which seats 5,750. By the time the Rice University Provost was introducing Al Gore, there were no empty seats that I could see, see Figure 1.
As a citizen of a third-world country, I bring a different perspective about climate change from that held by most people in wealthy countries. While they fret about possible tenth-of-a-degree changes in global average temperature, I think about how a billion of my fellow Indians and I will obtain the food, water, health care, and other things we need that our richer neighbors take for granted.
Regular readers at Anthony’s Watts Up With That will know that for several years, since July 2013 in fact, I have been trying to publish an analysis of climate model error.
The analysis propagates a lower limit calibration error of climate models through their air temperature projections. Anyone reading here can predict the result. Climate models are utterly unreliable. For a more extended discussion see my prior WUWT post on this topic (thank-you Anthony).
by S. Kamal et al., September 30, 2017 in Environment SystemsDecisions
Within this scope, the results reveal a pattern of the climatic effect of desert urbanization with nighttime warming and weaker, but significant daytime cooling. This effect is confined to the urban area and is not sensitive to the size of the city or the detailed land cover types in the surrounding areas. The pattern is identified in both winter and summer.
Electricity Consumers Fully Support Scientists’ Letter to EPA Calling for Immediate Reopening of its GHG Endangerment Finding
Key Points: This Letter from over 60 highly credentialed scientists states that: “We the undersigned are individuals who have technical skills and knowledge relevant to climate science and the GHG Endangerment Finding. We each are convinced that the 2009 GHG Endangerment Finding is fundamentally flawed and that an honest, unbiased reconsideration is in order.”
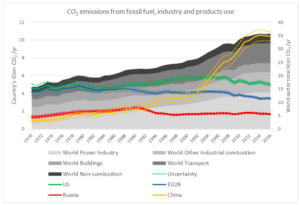
The annual assessment of global greenhouse gas (GHG) emissions by the JRC and the Netherlands Environmental Assessment Agency (PBL) confirms that CO2 emissions have stalled for the third year in a row.
The report provides updated results on the continuous monitoring of the three main greenhouse gases: carbon dioxide (CO2), methane (CH4) and nitrous oxide (N2O).
by Mark Lawson, October, 20, 2017 in ClimateChangeDispatch
Tony Abbott may have annoyed the climate change mob with his speech in London (see Diary), but a far more serious problem for that industry is an admission that global temperatures have not been following climate models.
(…) It appears that the much larger changes predicted by other models arise from additional water vapor evaporated into the atmosphere and not from the CO2 itself (…)
(…) Assuming a doubling of CO2 by the late 21st century (assuming no positive water vapor feedback), we should likely expect to see no more than about 0.3-0.5°C global surface warming and certainly not the 2-5°C warming that has been projected by the GCMs [global circulation models (…)
by Hermann Harde, March 30, 2017 in Inter.J.Atm.Sciences
Including solar and cloud effects as well as all relevant feedback processes our simulations give an equilibrium climate sensitivity of = 0.7°C (temperature increase at doubled CO2) and a solar sensitivity of = 0.17°C (at 0.1% increase of the total solar irradiance). Then CO2 contributes 40% and the Sun 60% to global warming over the last century.
Physical, mathematical and observational grounds are employed to show that there is no physically meaningful global temperature for the Earth in the context of the issue of global warming. While it is always possible to construct statistics for any given set of local temperature data, an infinite range of such statistics is mathematically permissible if physical principles provide no explicit basis for choosing among them. Distinct and equally valid statistical rules can and do show opposite trends when applied to the results of computations from physical models and real data in the atmosphere. A given temperature field can be interpreted as both “warming” and “cooling” simultaneously, making the concept of warming in the context of the issue of global warming physically ill-posed.
Future global climate projections have been put on more solid empirical ground, thanks to new measurements of the production rates of atmospheric aerosol particles by CERN’s Cosmics Leaving OUtdoor Droplets (CLOUD) experiment
In stark contrast to the sharp decline in Arctic sea ice, there has been a steady increase in ice extent around Antarctica during the last three decades, especially in the Weddell and Ross seas. In general, climate models do not to capture this trend and a lack of information about sea ice coverage in the pre-satellite period limits our ability to quantify the sensitivity of sea ice to climate change and robustly validate climate models
Le jury pensait, bien sûr, désigner plus tôt le vainqueur de septembre 2017 de la propagande climatique. Il demande pardon aux lecteurs pour avoir à ce point aiguisé leur impatience, mais dispose toutefois d’une circonstance fortement atténuante : à quel irrépressible élan a-t-il fallu faire face !
Quelle fougue des compétiteurs, nouveaux comme anciens, a déferlé ce mois-ci, rendant le choix final tout simplement impossible !
Satellite measurements of Antarctic sea ice do not go back even 40 years. That’s not very much, especially when we consider that many natural climate cycles have periods of 60 years and more.
Luckily we have the field of climate reconstruction. Using historical documents and sediment cores, the development of ice cover can be estimated. In November, 2016, Tom Edinburg and Jonathan Day examined shipping log books from the time of Antarctic explorers and published on ice extent in The Cryosphere (…)
A recently highlighted paper published by atmospheric scientists Scafetta et al., (2017) featured a graph (above) documenting post-2000 trends in the published estimates of the Earth’s climate sensitivity to a doubling of CO2 concentrations (from 280 parts per million to 560 ppm).
La géologie, une science plus que passionnante … et diverse