“Les faits, et seulement les faits” doivent nous éclairer et nous préserver de malentendus entourant toute discussion, alors que l’administration Trump a pris la décision de se retirer de l’Accord de Paris COP21 (2015) qui traite du changement climatique.
Si vous pensez que la conférence sur le climat qui se tiendra à Paris en décembre 2015 (COP21) a quelque chose à voir avec le climat ou la protection de la nature, révisez votre copie. Vous avez tout faux. Les premiers qui s’en rendront compte, après avoir vainement fouillé dans les derniers recoins de ces futurs accords, minimalistes et non-contraignants mais présentés par les politiques comme une grandiose réussite pour l’environnement et le climat, seront les écolos et certaines ONG environnementales.
“It is tempting to say that the record low we are seeing this year is global warming finally catching up with Antarctica,” Meier said. “However, this might just be an extreme case of pushing the envelope of year-to-year variability. We’ll need to have several more years of data to be able to say there has been a significant change in the trend.”
Partly in response to the crazy claims of the usual global warming experts (Stevie Wonder, Beyoncé, Jennifer Lawrence, Mark Ruffalo, Bill Nye the Science Guy, Neil deGrasse Tyson, Pope Francis), I decided to write another Kindle e-book. This one is entitled, Inevitable Disaster: Why Hurricanes Can’t Be Blamed On Global Warming.
by P. Homewood, September 22, 2017 in NotaLotofPeopleKnowThat
As Hurricane Maria heads north as a Cat 3 storm, much is being made of the fact that it is the strongest hurricane to hit Puerto Rico since 1928. The implication is that Maria must have been exceptionally strong.
But the reality is that Puerto Rico is little more than a speck in the vastness of the Atlantic Ocean. The odds of the eye of a major hurricane, often just 10 or 20 miles wide, making a direct hit on Puerto Rico are probably hundreds to one, given that there are thousands of miles of ocean through which hurricanes can commonly travel.
With the help of satellite observations from 188 lakes worldwide, scientists have shown that the warming of large lakes amplifies their color. Lakes which are green due to their high phytoplankton content tend to become greener in warm years as phytoplankton content increases. Clear, blue lakes with little phytoplankton, on the other hand, tend to become even bluer in warm years caused by declines in phytoplankton. Thus, contrary to previous assumptions, the warming of lakes tends to amplify their richness or poverty of phytoplankton.
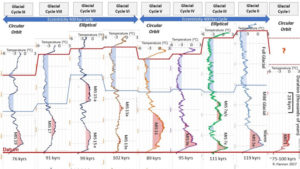
Results indicate climate models where the initiation of glaciation depends strongly on CO2concentrations over astronomical controls significantly overpredict the duration of the present-day warm period compared to past interglacial analogs.
(…) Upon our return to the Hotel after visiting the Glacier, we noticed that our brand-new photos appear to show that the Grinnell Glacier has grown slightly from the 2008 images that are displayed on the Hotel walls. There has been no reporting of this in any newspaper or broadcast that we know of. (In fact, all news coverage reports the precise opposite.) The smaller Gem Glacier—which is visible from the valley miles below—also appears to be slightly larger than it is shown in 2008 pictures on display.
by Sebastien Laye, September 18, 2017 in NotaLotofPeopleKnowThat
Those voices are the impetus behind what Subramanian calls a “green and clean coal coalition” spanning both the developed and developing worlds. Emerging markets in Asia and Africa will continue to build new coal-fired power stations for at least the next two decades. In that timeframe, coal-fired solutions are indispensable to meeting their demands for electrification and growth. As clean coal solutions emerge, new plants in the developing world can and should be far cleaner than previous generations of coal-fired plants in Europe and America.
The study is published in the journal Nature Geoscience by a team of scientists led by Richard Millar of the University of Oxford. It has recalculated the carbon budget for limiting the Earth’s warming to 1.5 degrees Celsius above temperatures seen in the late 19th century. It had been widely assumed that this stringent target would prove unachievable, but the new study would appear to give us much more time to act if we want to stay below it.
by Arthur Viterio, 2016, in J Earth Science Climate Change
Earth’s climate is a remarkably “noisy” system, driven by scores of oscillators, feedback mechanisms, and radiative forcings. Amidst all this noise, identifying a solitary input to the system (i.e., HGFA MAG4/6 seismic activity as a proxy for geothermal heat flux) that explains 62% of the variation in the earth’s surface temperature is a significant finding.
by Cédric Moro, 18 septembre 2017 in Mythes,Mancies&Mathématiques
Que n’a-t-on pas entendu dans une partie de la presse et dans les déclarations à chaud de scientifiques et d’experts du climat sur l’uragan Irma. C’était du jamais vu, du jamais mesuré, d’une puissance inégalée, Europe 1 allant jusqu’à parler « du plus important de l’histoire climatologique ». Des eaux extraordinairement chaudes devaient expliquer son intensité effroyable (sous-entendu : Irma, c’est la faute au réchauffement), ses vents destructeurs records, son diamètre exceptionnel, ses pluies diluviennes, son raz de marée démesuré, son intensification inouïe ou ses dégâts hors normes…
by Javier, September 15, 2017, in Judith Curry Climate Etc.
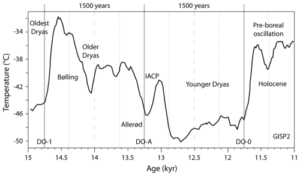
The existence of a 1500-year climatic cycle during the Holocene, related to the glacial Dansgaard-Oeschger cycle, is a matter of intense debate. However, by introducing precise timing requirements it can be shown that the 1500-year cycle displayed in Northern Hemisphere glacial records is also observed in Holocene records from all over the world.
The cycle is most prominently displayed in oceanic subsurface water temperatures, Arctic atmospheric circulation, wind deposits, Arctic drift ice, and storminess records.
Climate Change: The Facts 2017 contains 22 essays by internationally-renowned experts and commentators, including Dr Bjorn Lomborg, Dr Matt Ridley, Professor Peter Ridd, Dr Willie Soon, Dr Ian Plimer, Dr Roy Spencer, and literary giant Clive James. Anthony Watts also has a chapter.
The volume is edited by Dr Jennifer Marohasy, Senior Fellow at the Institute of Public Affairs. Fourteen of the contributors currently hold or have held positions at a university or a scientific research organisation.
Zerbini et al. also investigated/tested for the existence of an acceleration of sea level rise in each of the six Mediterranean station’s data, reporting that “our analysis indicates that it is not possible to reliably state the existence of any acceleration, in the area of this study, considering the past 140 years or so, from 1870 through 2012.”
The record-setting twelve-year long hurricane “drought” (no major hurricane landfalls on the US) was just weather. But the Left immediately boldly and confidently declared Harvey and Irma to be caused (or worsened) by anthropogenic climate change. Some of these screeds are mostly rational, just exaggerated or imbalanced.
by Anastasios Tsonis, September 15, 2017 in GWPF Report26 (.pdf)
This report describes this phenomenon and brings it into a modern global con- text. But the story is more than simply one of some old South American geophysical phenomenology seen from a global perspective; it is tied to an extraordinary story about new scienti c thinking, arising at the end of the 20th century, concerning the nature of change itself.
The discovery of volcanoes under the Antarctic ice sheet may be old news, but now we have evidence that at least some of them have recently (geologically speaking) erupted…
I have written about sea level rise here: here, here, here, here and here. The previous essays are not prerequisites but are interesting specific examples.
There are two important points which readers must be aware of from the first mention of SLR:
SLR is a real imminent threat to coastal cities and low-lying coastal and near-coastal densely-populated areas.
SLR is not a threat to anything else — not now, not in a hundred years — probably not in a thousand years — maybe, not ever.
by Paul Homewood, September 1, 2017 in NotaLotofPeopleKnowThat
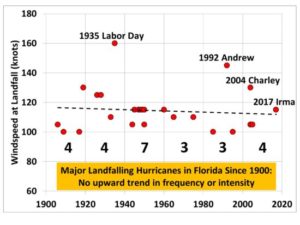
Since 1851, there have been 14 stronger hurricanes at landfall, and Irma ties with 10 others. In other words, Irma is one of 25 hurricanes as strong or stronger.
Le cyclone Irma qui a dévasté Saint-Martin et Saint-Barthélémy dans les Antilles françaises a servi de prétexte à de nombreux commentateurs et journalistes pour en remettre une couche sur les “dérèglements climatiques d’origine humaine”. Comme d’habitude, les vagues éléments de prudence rappelant qu’on ne peut tirer de conclusions d’un élément isolé ont vite été noyés par les “appels à l’action” et l’invocation de l’Accord de Paris de 2015.
Or s’agissant du climat aux Antilles l’année 2015 a été importante pour une toute autre raison que la signature de l’Accord de Paris : c’est l’année de publication d’un article de recherche tout à fait passionnant sur les ouragans dans cette région du monde.