by Dr. M. Wielicki, Dec 02, 2025 in ClimateChangeDispatch
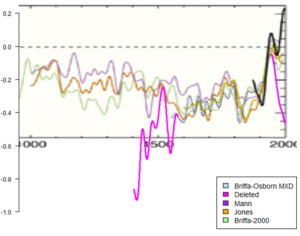
Everyone has seen some version of the climate hockey stick by now.
A thousand years of nearly flat, gently cooling temperatures… then a vertical blade in the twentieth century. That picture is used to sell a straightforward story. [some emphasis, links added]

The past was stable and boring, the present is sharply different; therefore, recent warming must be almost entirely caused by human CO2 emissions, and we face an unprecedented crisis that justifies emergency policies, Net Zero deadlines, and trillions in spending.
You’ve also likely seen those trendy “warming stripes” graphics plastered everywhere… blue fading to red, screaming that our planet’s suddenly turned into a furnace thanks to human CO2.
…
cards, a deliberate distortion that hides Earth’s wild, natural temperature swings?
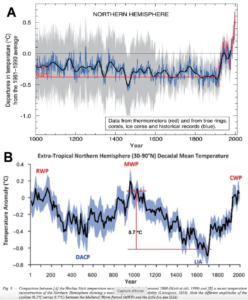
Enter the smoking gun: Figure 5 from the 2020 study, “Prominent Role of Volcanism in Common Era Climate Variability and Human History“, published in Dendrochronologia.


 Cropped from Figure 1,