Archives de catégorie : climate-debate

New Climate Models (CMIP6) Offer No Improvement, Model Discrepancies As Large As The Last Version (CMIP5)

by K. Richard, Dec 24, 2020 in NoTricksZone


The “unsatisfactorily large” magnitude of the discrepancies between models in estimating the various radiative contributions to Earth’s energy imbalance serves to undermine confidence that CO2’s small impact could even be detected amid all the uncertainty.

Scientists have engaged in offering their educated guesses, or estimates, of cloud radiative effects for decades.

In the latest models, CMIP6, the top of atmosphere (TOA) net cloud radiative effects (CRE) when considering clouds’ longwave and shortwave combined impact is somewhere between -17 W/m² and -31 W/m² (Wild, 2020). That’s a 14 W/m²spread in CRE modeling.

The discrepancy range between modeled estimates for downward longwave clear-sky radiation is 22.5 W/m². This is the component where CO2’s underwhelming 0.2 W/m² per decade impact (Feldman et al., 2015) is manifested. Modeling discrepancies are thus more than 100 times larger than CO2’s forcing contribution over a 10-year period.

ELEVEN YEARS AGO TODAY AL GORE PREDICTED THE NORTH POLE WOULD BE COMPLETELY ICE FREE IN FIVE YEARSp

by Cap Allon, Dec 13, 2020 in Electroverse


On December 13 & 14, 2009, professor, prophet, and soothsayer Al Gore predicted the North Polar Ice Cap could be completely ice free within the next five to seven years.


Gore made his prediction at COP15 Copenhagen which ran from Dec 7 – Dec 18, 2009, where he repeatedly referenced “state-of-the-art” computer modeling to suggest that the north polar ice cap may lose all of its ice by 2014.

“Some of the models suggest that there is a 75 percent chance that the entire north polar ice cap, during some of the summer months, could be completely ice-free within the next five to seven years,” Gore claimed.

“Join me in asking president Obama and the US Senate to set a deadline of 22 April for final action in the US Senate,” he said. “I do not believe we can wait till next November or December.”

The Guardian wrote on Dec 16, 2009 in an article entitled “Al Gore rallies the troops in Copenhagen“:

[Gore] kept up the pace by calling for the international community to sign up to a fully fledged climate change treaty by July 2010 – and then announcing that Mexico was prepared to host a deal-making summit.

He scolded rich countries for demanding the developing world offer evidence of emissions cuts while at the same time trying to inflate the funds they were prepared to offer poor countries to deal with climate change. And he was just as tough on activists who have embraced him as a hero, demanding they set aside their pride and their principles and embrace a deal – no matter how imperfect. He said he recognized their frustration with the glacial pace of negotiations. He agreed that cap-and-trade schemes to cut carbon emissions were an imperfect solution – Gore confessed to favoring a carbon tax – but the current efforts for a deal were the best prospect of avoiding catastrophic climate change.

And there was no trace of sympathy for opponents of action on climate change. Gore began with a brief run-through of the latest science on melting of the Arctic ice cap, evidence he said “only reckless fools would ignore.”

2020 Review: Observational And Modeling Studies Show Temperature Falls As CO2 Rises

by K. Richard, Dec 28, 2020 in NoTricksZone


A 2020 observational study (Zhang et al., 2020) determined “temperatures of atmospheric air with substantially higher CO2 concentration (ranging from 3200 ppm to 16,900 ppm) were lower than that with the lower CO2 concentration (480 ppm)” and a 2020 modeling study (Drotos et al., 2020) assessed that when CO2 goes beyond 4 times preindustrial – 1,120 ppm – “climate sensitivity decreases to nearly zero” because the climate cyclically cools by 10 K.

So the science is settled, right?


….

Greenland Fall Temperatures Unchanged. Proxy Data Show No Warming At 8 Of 9 Antarctic Peninsula Sites Since 1830!

by Kyrie, Dec 29, 2020 in NoTricksZone


Before looking at Antarctica Peninsula, we first take a look at Greenland, which also is considered by the global warming alarmists to be part of the most threatening tipping points. If the ice on Greenland ever melted, like they warn it will, sea levels globally would rise some 6 meters. (Never mind this scenario would take many centuries).

Today we look at the November and autumn trends in Greenland. First we look at November mean temperatures for which the Japan meteorological Agency (JMA) has sufficient data to compute a trend going back to 1999.


Four of the 6 stations examined show cooling or no warming trend.

But that’s only for one month, and so doesn’t really tell us a whole lot. So next we look at autumn mean temperatures for these six stations. If autumn is warming then we no that is not ideal for the overall ice formation season.

Newly Discovered Greenland Plume Drives Thermal Activities in the Arctic

by C. Rotter, Dec 29, 2020  in WUWT


A team of researchers understands more about the melting of the Greenland ice sheet. They discovered a flow of hot rocks, known as a mantle plume, rising from the core-mantle boundary beneath central Greenland that melts the ice from below.

The results of their two-part study were published in the Journal of Geophysical Research.

“Knowledge about the Greenland plume will bolster our understanding of volcanic activities in these regions and the problematic issue of global sea-level rising caused by the melting of the Greenland ice sheet,” said Dr. Genti Toyokuni, co-author of the studies.

The North Atlantic region is awash with geothermal activity. Iceland and Jan Mayen contain active volcanoes with their own distinct mantle plumes, whilst Svalbard – a Norwegian archipelago in the Arctic Ocean – is a geothermal area. However, the origin of these activities and their interconnectedness has largely been unexplored.

The research team discovered that the Greenland plume rose from the core-mantle boundary to the mantle transition zone beneath Greenland. The plume also has two branches in the lower mantle that feed into other plumes in the region


Alarmism Dies In The Maldives: 97% Of 186 Island Coasts Have Grown (59%) Or Not Changed (38%) Since 2005

by C. Rotter, Dec 22, 2020 in WUWT


Reposted from NoTricksZone

By Kenneth Richard on 21. December 2020

Despite sea level rise, a 2019 global analysis (Duvat, 2019) found 89% of 709 island coasts have been either stable or growing in size in recent decades. A new Maldives-only study (Duvat, 2020) finds rapid (>3 to >50%) coastal growth in 110 of 186 Maldives islands from 2005 to 2016. Just 5 islands – 2.7% – actually contracted in size during this period.

Last year Dr. Virginie Duvat published a global assessment of how the Earth’s islands and atolls are faring against the ongoing challenge of sea level rise since satellite monitoring began in the 1980s.

Fortunately she found “no widespread sign of physical destabilization in the face of sea-level rise.” In fact, a) none of the 30 atolls analyzed lost land area, b) 88.6% of the 709 islands studied were either stable or increased in area, c) no island larger than 10 hectare (ha) decreased in size, and d) only 4 of 334 islands (1.2%) larger than 5 ha had decreased in size.

The World’s Greatest Climate Hypocrite

by GWPF, 2019


Competition is fierce for this year’s Climate Hypocrite of the Year Awards; no more so than in the Luvvie Section. Past winner Leonardo DiCaprio is, as ever, one of the frontrunners. When he’s not lecturing us on climate change, our Leo (`Climate change is real, it is happening right now. It is the most urgent threat facing our entire species’) is cruising on his private yacht or flying between his four luxury homes in New York and California.

Even by Hollywood luvvie standards, DiCap-
rio’s appetite for private jet travel is legendary.
Yet despite his ostentatious lifestyle, he has, for some strange reason, been a board member
of WWF and the National Resources Defense Council, and a UN representative on climate change

NYT: “What happened to Global Warming?”

by E. Worrall, Dec 17, 2020 in WUWT


NYT rolling out the tired global warming makes winter storms more extreme narrative.

How climate change is affecting winter storms.


By John Schwartz

The major winter storm that hit the Eastern United States on Wednesday and Thursday probably prompted some people to ask, “What happened to global warming?”

But although it’s becoming increasingly clear that climate change does have an effect on storms, the relationship can be complex and, yes, counterintuitive. “There were these expectations that winter was basically going to disappear on us,” said Judah Cohen, director of seasonal forecasting at AER, a company that provides information to clients about weather and climate-related risk.

Although winters are becoming warmer and somewhat milder over all, extreme weather events have also been on the increase, and especially in the Northeastern United States, as Dr. Cohen pointed out in a recent paper in the journal Nature Climate Change. From the winter of 2008-9 until 2017-18, there were 27 major Northeast winter storms, three to four times the totals for each of the previous five decades.

Read more: https://www.nytimes.com/2020/12/17/climate/climate-change-winter.html

If global warming to date has caused a three to four fold increase in severe winter storms, imagine the bitterly cold weather the next few decades of global warming will bring.

We must act now, before global warming causes us all to freeze to death!

Eastern Alps may have been ice-free in the time of Ötzi the Iceman

by C. Rotter, Dec 21, 2020 in WUWT


From The New Scientist

Glaciers in the Ötztal Alps in Austria are currently melting and may be lost within two decades, but this might not be the first time humans have seen this kind of change. A new analysis reveals that glaciers in this region formed just before or perhaps even within the lifetime of Ötzi the Iceman, a mummified body found just 12 kilometres away in 1991.

Pascal Bohleber at the Austrian Academy of Sciences in Vienna and his colleagues drilled 11 metres into the Weißseespitze summit glacier, down to the bedrock, at 3500 metres altitude and collected two ice cores. They then used radiocarbon dating to  analyse microscopic bits of organic material extracted from the ice cores and found that the glacier is 5200 to 6600 years old. Ötzi is thought to have lived between 5100 and 5300 years ago, and his body was found preserved in ice.

The glacier’s age means it formed during a time called the mid-Holocene warm period, when Earth’s climate was warmer than it is now. It is also dome-shaped, which Bohleber says is rare in the Alps and means that the ice has seen very little movement over time, meaning we can use it to study the climate when it formed.

Read more: Ötzi the Iceman’s last journey revealed by moss found in his stomach

“More information on the mid-Holocene warm period, when the glaciers were smaller than today, is direly needed so that we can better predict how the glaciers will respond to the anticipated future climate over the next 50 years,” says Bethan Davies at Royal Holloway, University of London.

Comparing ice cores from different sites tells us quite a bit about the past climate in that region, says Bohleber, but that gets harder as the glaciers thaw. Meltwater makes it more difficult to drill for ice cores and causes the glaciers to slide downhill, exposing the ancient ice to modern contaminants.

Read more: https://www.newscientist.com/article/2263399-eastern-alps-may-have-been-ice-free-in-the-time-of-otzi-the-iceman/#ixzz6hDkuLfkW

See also  in GWPF

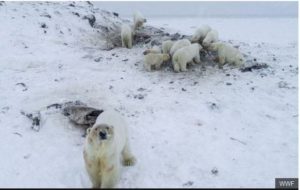
Polar bears again attracted to Russian town by dead walrus Attenborough blames on no sea ice

by Polar Bear Science, Dec 20, 2020


In the news again: Cape Schmidt (on the Chukchi Sea) made famous by Sir David Attenborough’s false claim that walrus fell to their deaths because of lack of sea ice due to climate change when a clever polar bear hunting strategy was actually to blame.

Last year in December (above), some bears were feeding at Ryrkaypiy’s garbage dump and wandering around town after being displaced from feeding on walrus carcasses by bigger, stronger bears on the nearby point.

This year, the town has managed to keep the bears out of town, so while the residents are having no real problems, more than 30 bears have been spotted near town, almost certainly feeding on natural-death carcasses of walrus along the shore (see photo below from 2017 where Ryrkaypiy can be seen in the background).


Wrong Again: 2020’s Failed Climate Doomsaying

by C. Rotter, Dec 18, 2020 in WUWT


Reposted from JunkScience.com

2020 has been the wildest and most unpredictable year in the memory of most people. But did the climate doom that was predicted to occur in or by 2020 materialize? What follows are 10 predictions made for 2020 and what really happened. As it turns out, climate doomsayers weren’t seeing so 20-20 when it came to 2020.

….

Another warm El Nino year

by GWPF, Dec 3, 2020


2020 is gearing up to be another warm year, strongly affected by natural and regional weather events

It’s that time of the year again when some meteorological organisations predict what the average global temperature might be for the full, current year. Not that we have all the data for 2020, obviously, for most global temperature datasets haven’t even processed November’s data yet. Making a prediction with only just over 80% of the data available is a risky procedure and most sensible scientists would be very circumspect about doing so. But these premature annual announcements are done for political purposes and, in a typical year, always as a precursor to a UN climate conference.

2020 has been a warm year, one of the warmest – and warm years make many people throw caution to the wind, making claims based on select facts they like, ignoring the ones they don’t like.

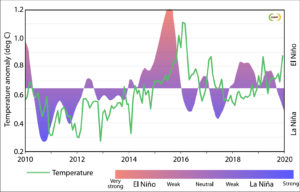
Let’s go back a few years to the early part of this decade when global temperature had been stagnating for more than ten years and not increasing significantly, as many had predicted. But then came 2014-15 when they started rising again, peaking in 2016. Many voices proclaimed that this was evidence that global temperatures were now accelerating ‘out of control’, something their models had been predicting all along. The climate was making up for all the unchanging years of the so-called global warming hiatus, it was claimed.

Never mind that the sudden rise between 2015 and 2016 was occurring much faster than could be due to greenhouse forcing alone.

2010 – 2020: HadCrut4 global surface temperature change (green); Oceanic Niño Index (ONI) (red/blues)

However, it was not a coincidence that 2016 experienced a record El Nino. For some commentators, however, an El Nino is a finite event. According to its definition – a specific temperature increase in a certain region of the Pacific – an El Nino is either on or off. Hence, they said that subsequent warm years after 2016 were warm due to greenhouse forcing, not El Nino. They argued that average global temperature since then was not influenced by any El Nino warming.

But that’s clearly not the case. The build-up in temperatures before recent El Ninos is obviously not independent of its peak and neither is the decline afterwards, else why did that increase not continue after the El Nino’s ‘interruption.’ So, a year can still be showing the warming influence of previous El Nino conditions whilst not having an El Nino event, something many journalists and even the General Secretary of the World Meteorological Organisation (WMO), Prof Taalas, prefer to ignore.


Today’s Iceland Colder, Icier Than In Last 8,000 Years (Except the 1800s)

by K. Richard, Dec 15, 2020 in ClimateChange Dispatch


A wealth of new research in glacier and sea ice extent shows modern Iceland is 2-4°C colder than all of the last 8,000 years except for a slightly colder late 19th century.

Even the 1700s were warmer with less ice than today in and around Iceland.

A new study (Geirsdóttir et al., 2020) now affirms peak Holocene warmth at least “∼3–4 °C above modern in Iceland” prevailed throughout much of the last 8,000 years.

Data from tree growth, glacier-induced soil erosion, algae productivity, sea ice biomarker proxies (IP25), and other climate indices affirm these conclusions.

Harning et al., 2020 report an overall 7°C Holocene cooling trend In Iceland’s surrounding sea surface temperatures (SST).

“In terms of foraminifera-reconstructed SST, there is an overall trend of cooling throughout the last 8 ka from ~10 °C to ~3 °C.”


It is only in the last few centuries of the modern era that temperatures sharply plummeted to their lowest values of the last 10,000 years (Geirsdóttir et al., 2020).

“The coolest climate of the last 10 ka occurred in the late 1800s CE.”

Consequent to the peak cooling, glaciers and sea ice reached their maximum extents of the Holocene just 150 years ago.

While Iceland’s glaciers and North Shelf sea ice extent did partially recover in the first half of the 20th century, the ice extents are still beyond what they were in the 1700s and earlier.

There is nothing to indicate modern warmth or ice recession in and around Iceland is unprecedented or even unusual.

Read more at No Tricks Zone

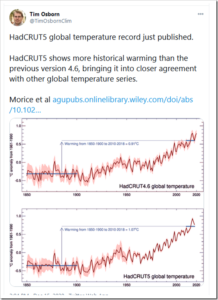
HadCRUT5 Adjusts Temperatures Upwards Again

by P. Homewood, Dec 16, 2020 in NotaLotofPeopleKnowThat


The Morice paper claims the extra warming has come from an improved representation of Arctic warming and a better understanding of evolving biases in sea‐surface temperature measurements from ships.

In fact it is not scientific to average together Arctic temperatures with the rest of the planet, as it is comparing apples with oranges. It all has to do with latent heat and water vapour, as Tony Heller brilliantly explained:

Britain’s Wild Weather–1940 Style

by P. Homewood, Dec 12, 2020 in NotaLotoPeopleKnowThat


The Winter of 1939/40

https://visitmarple.co.uk/photos/displayimage.php?album=123&pid=6858


According to the BBC/Met Office, Britain’s weather has been wild this year, and it is getting wilder. And their evidence?

A wet February, dry May and a couple of hot days in August. Statistically of course, you are likely to get one of two of these sort of events every year, with records going back 150 years or so.

So let’s go back and compare 2020 with some earlier years on record. Far from cherry picking years, I am only going to look at years ending in a zero, starting with 1940. The years 1950 and 1960 will follow later.

The year started with what was the coldest January on record at the time, a record which has only been beaten since by the infamous winter of 1962/63.

Sea surface skin temperature

by A. May, Dec 9, 2020 in WUWT


In previous posts, see here and here, I’ve tried to show that because the oceans cover 71% of Earth and they contain 99% of the thermal energy stored on the Earth’s surface, they dominate the speed and magnitude of climate changes. In all my posts the Earth’s surface is defined as everything from the ocean floor to the top of the atmosphere. The details of the calculation of ocean and atmospheric heat content is detailed in this spreadsheet. The ocean’s huge heat capacity prevents large temperature swings and dampens and delays those that do occur.

Attempting to show the direction, speed, and magnitude of climate change by measuring and averaging atmospheric surface temperatures is pointless, in my opinion. The record we have of atmospheric and ocean surface temperatures is too short and far too inaccurate to provide us with useful trends on a climatic (30 years +) time scale. Further, these records are sporadic measurements in a chaotic surface zone that has large temperature swings. In Montana, United States, for example, recent minimum/maximum temperatures have been as low as -70°F (-57°C) and as high as 117°F (47°C). These enormous swings make measuring year-to-year global average differences of 0.1°C exceedingly difficult. Yet, this is the precision demanded if we are to properly characterize a climate that is only warming at a rate of roughly 1.4°C/century, which is 0.014°C per year and 0.14°C/decade.

New sunspot cycle could be one of the strongest on record, new research predicts

by National Center for Atmospheric Research/University Corporation for Atmospheric Research, Dec 7, 2020 in ScienceDaily


In direct contradiction to the official forecast, a team of scientists led by the National Center for Atmospheric Research (NCAR) is predicting that the Sunspot Cycle that started this fall could be one of the strongest since record-keeping began.

In a new article published in Solar Physics, the research team predicts that Sunspot Cycle 25 will peak with a maximum sunspot number somewhere between approximately 210 and 260, which would put the new cycle in the company of the top few ever observed.

The cycle that just ended, Sunspot Cycle 24, peaked with a sunspot number of 116, and the consensus forecast from a panel of experts convened by the National Aeronautics and Space Administration (NASA) and the National Oceanic and Atmospheric Administration (NOAA) is predicting that Sunspot Cycle 25 will be similarly weak. The panel predicts a peak sunspot number of 115.

L’effet de serre et le bilan énergétique de la Terre

by G. Gueskens, Dec 11, 2020 in ScienceClimatEnergie


Dans presque toutes les sciences, les notions élémentaires sont les plus difficiles et elles sont parfois mal comprises. Par la suite, elles sont souvent  négligées car elles ne s’opposent pas à la publication d’articles dans des domaines spécialisés où les auteurs, à la recherche de notoriété ou de subsides, sont jugés par leurs pairs. La climatologie, science récente et pluridisciplinaire par essence, n’échappe pas à cette règle. C’est ainsi que beaucoup de climatologues, réputés tels ou simples amateurs, développent des théories dont les hypothèses sont contraires aux principes fondamentaux de la chimie et de la physique. Néanmoins,  sur la base de ces théories mal étayées, des modèles informatiques sont élaborés qui conduisent, avec une précision rassurante, à des prévisions alarmantes. Dans cette note nous rappellerons d’abord quelques notions élémentaires concernant l’émission et l’absorption de rayonnements par la Terre et par les gaz atmosphériques avant de revoir d’un point de vue critique les notions généralement admises à propos de l’effet de serre et du bilan énergétique de la Terre.

1. Deux types de rayonnement à ne pas confondre.

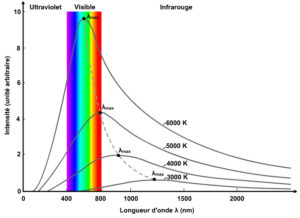
Fig. 1 Rayonnement thermique d’un corps solide à différentes températures

SUMMER SNOW FALLING IN NEW ZEALAND + GLOBAL COOLING

by Cap Allon, Dec 11, 2020 in Electroverse


A ‘white Christmas’ is an absurd prospect in New Zealand, but Southlanders could be forgiven for placing a bet or two this year after rare summer snow blanketed regions below 200m (650ft) Friday, December 11.

As originally reported by stuff.co.nz, temperatures plummeted overnight and snow, quite substantial in some parts, was falling in Northern Southland Friday morning–on State Highway 6 between Lumsden and Kingston, on Gorge Hill between Te Anau and Mossburn, and in hill country in the province.

There was also snow on the Remarkables mountain range in Queenstown, and flakes had settled in Arrowtown and in Garston. Photos of the snowfall were posted on the South Proud NZ Facebook Page with the caption: “Garston having a bit of a snow day today! So much for Summer huh?”


The natural ‘Himalayan aerosol factory’ can affect climate

by University of Helsinki, Dec 10, 2020 in WUWT


Large amounts of new particles can form in the valleys of the Himalayas from naturally emitted gases and can be transported to high altitudes by the mountain winds and injected into the upper atmosphere.

The emitted particles may eventually affect climate by acting as nuclei for cloud condensation. These new findings about particles formation and sources will contribute to a better understanding of past and future climate.

“To understand how the climate has changed over the last century we need to know as reliably as possible the natural atmospheric conditions before the industrialization,” says Associate Professor Federico Bianchi from the University of Helsinki’s Institute for Atmospheric and Earth System Research (INAR).

In order to do that scientists are looking for pristine locations around the world where human influence is minimal. An international group of researchers has now completed a comprehensive study at the Nepal Climate Observatory at Pyramid station, located in the proximity of the Everest base camp at 5050 m above sea level. There, they were able to investigate the formation of atmospheric particles far from human activities. The results were published today in the prestigious journal Nature Geoscience.

Peter Ridd: It’s the science that’s rotten, not the Great Barrier Reef

by P. Homewood, Dec 7, 2020 in NotaLotofPeopleKnowThat


The International Union for Conservation of Nature has released its latest report on the state of the Great Barrier Reef. It has turned up the volume by one notch, claiming the threat to the reef has gone from “significant concern” to “critical”. It blames climate change, agricultural pollution, coastal development, industry, mining, shipping, overfishing, disease, problematic native species, coal dust — you name it, it is killing the reef.

But the report is just a rehash of old, mostly wrong or misleading information produced by generally untrustworthy scientific institutions with an activist agenda and no commitment to quality assurance.

It is remarkable that the world has been convinced that one of its most pristine ecosystems is on its last legs. Part of the problem is that, being underwater and a long way from the coast, very few people visit the reef. The truth is hidden. Those of us in North Queensland living adjacent to the reef, and tourists from elsewhere, can report the water is iridescent clear blue and totally unpolluted. The fish and coral are fabulous.

CO2 Coalition: “The Global Mean Temperature Anomaly Record How it works and why it is misleading”

by D. Middleton,  Dec 8, 2020 in WUWT


Our friends at the CO2 Coalition have published another excellent report.

This white paper by Richard Lindzen and John Christy explores the global mean temperature anomaly record. Their focus isn’t on whether it’s right or wrong; it’s on its significance relative to natural variability and its inherently low signal-to-noise ratio. Here’s the executive summary:

STUDIES AND RESOURCES, WHITE PAPERS AND OTHER PUBLICATIONS

4 DEC, 2020
The Global Mean Temperature Anomaly Record
How it works and why it is misleading

by Richard S. Lindzen and John R. Christy

The CO2 Coalition is honored to present this Climate Issues in Depth paper by two of America’s most respected and prolific atmospheric physicists, MIT professor emeritus Richard Lindzen, who is a longtime member of the Coalition, and University of Alabama in Huntsville professor John Christy.

Professor Lindzen has published over 200 scientific articles and books over a five-decade career. He has held professorships at the University of Chicago, Harvard University and MIT. He is a fellow and award recipient of the American Meteorological Society and the American Geophysical Union. He is also a member of the National Academy of Science and was a lead author of the UN IPCC’s third assessment report’s scientific volume. His research has highlighted the scientific uncertainties about the impact of carbon dioxide emissions on temperature and climate more generally.

Professor Christy, the director of the Earth System Science Center at The University of Alabama in Huntsville, began studying global climate issues in 1987. He has been Alabama’s State Climatologist since 2000 and a fellow of the American Meteorological Society since 2002. He and CO2 Coalition member Dr. Roy W. Spencer developed and have maintained one of the key global temperature data sets relied on by scientists and government bodies, using microwave data observed in the troposphere from satellites since 1979. For this achievement, they were awarded NASA’s Medal for Exceptional Scientific Achievement.

The purpose of this paper is to explain how the data set that is referred to by policy-makers and the media as the global surface temperature record is actually obtained, and where it fits into the popular narrative associated with climate alarm.

Executive Summary
At the center of most discussions of global warming is the record of the global mean surface temperature anomaly—often somewhat misleadingly referred to as the global mean temperature record. This paper addresses two aspects of this record. First, we note that this record is only one link in a fairly long chain of inference leading to the claimed need for worldwide reduction in CO2 emissions. Second, we explore the implications of the way the record is constructed and presented, and show why the record is misleading.

This is because the record is often treated as a kind of single, direct instrumental measurement. However, as the late Stan Grotch of the Laurence Livermore Laboratory pointed out 30 years ago, it is really the average of widely scattered station data, where the actual data points are almost evenly spread between large positive and negative values.

The average is simply the small difference of these positive and negative excursions, with the usual problem associated with small differences of large numbers: at least thus far, the one-degree Celsius increase in the global mean since 1900 is swamped by the normal variations at individual stations, and so bears little relation to what is actually going on at a particular one.

Climate Activism: How Democracy Dies

by Donna Laframboise, Dec 6, 2020 in BigPicturesNews


Tomorrow night, Friends of Science will broadcast my speech, Climate Activism: Undermining Free Speech, Free Thought & Free Choice. Click here for details. (If you aren’t able to tune in then, purchasing a ticket will permit you to stream the event later, at your convenience.)

40 minutes in length, this talk explores how prominent members of the establishment have worked to shut down climate-related dialogue and debate. Those who express minority opinions have been cast as defective, depraved individuals on a par with Holocaust deniers.

The people fueling this incredible intolerance are prime ministers, vice presidents, UN officials, Nobel laureates, and Pulitzer Prize winners. There’s nothing admirable about silencing non-conformist perspectives. That’s how democracy dies.

The cancel culture now on full display on social media, in newsrooms, and on university campuses took root early in the climate world. Perhaps if more people had objected – loudly and on principal – to that improper behaviour, we’d be in a healthier, more tolerant place today.

Here’s a quote from my speech:

Claim: The climate changed rapidly alongside sea ice decline in the north

by University of Copenhagen, Dec 6, 2020 in WUWT


Researchers from the Niels Bohr Institute, University of Copenhagen have, in collaboration with Norwegian researchers in the ERC Synergy project, ICE2ICE, shown that abrupt climate change occurred as a result of widespread decrease of sea ice. This scientific breakthrough concludes a long-lasting debate on the mechanisms causing abrupt climate change during the glacial period. It also documents that the cause of the swiftness and extent of sudden climate change must be found in the oceans.

Scientific evidence for abrupt climate change in the past finally achieved

During the last glacial period, app. 10,000 – 110,000 years ago the northern hemisphere was covered in glacial ice and extensive sea ice, covering the Nordic seas. The cold glacial climate was interrupted by periods of fast warmup of up to 16.5 degrees Celsius over the Greenland ice sheet, the so called Dansgaard Oeschger events (D-O).

These rapid glacial climate fluctuations were discovered in the Greenland ice core drillings decades ago, but the cause of them have been hotly contested. D-O events are of particular significance today as the rate of warming seems to be very much like what can be observed in large parts of the Arctic nowadays. The new results show that the abrupt climate change in the past was closely linked to the quick and extensive decline in sea ice cover in the Nordic seas. Very important knowledge as sea ice is presently decreasing each year.

“Our, up until now, most extensive and detailed reconstruction of sea ice documents the importance of the rapid decrease of sea ice cover and the connected feedback mechanisms causing abrupt climate change”, says Henrik Sadatzki, first author of the study.

Sediment core and ice core data were combined in order to achieve the result

No, It Was Not A Record Hurricane Season!

by P. Homewood, Dec 3, 2020 in NotaLotofPeopleKnowThat


Inevitably the busy hurricane season this year is getting blamed on global warming:

But first of all, let’s get one thing clear – there was not a record number of hurricanes this year in the Atlantic. There were 13 hurricanes, compared to 15 in 2005:

https://www.aoml.noaa.gov/hrd-faq/#tcs-after-1930


It is true that there were more named storms, which includes tropical storms as well as hurricanes, this season than in any other year, but this is quite meaningless. Over the years, reporting practices have drastically changed, so that more storms are spotted and named now.