Archives par mot-clé : 2020

Extremest Weather 2020

by Ralph Alexander, April 2021 in GWPF


Contents

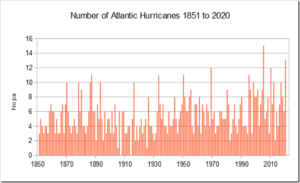
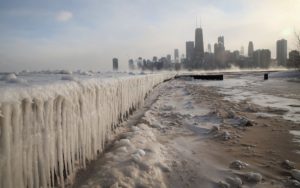
About the author iii Executive summary v 1. Introduction 1 2. Natural disaster analysis 2 3. Heatwave 6 4. Cold extremes 12 5. Drought 14 6. Precipitation and floods 16 7. Hurricanes 19 8. Tornadoes 23 9. Wildfires 26 10. Conclusions 31 Notes 33 Review process 38 About the Global Warming Policy Foundation 38

About the author

Retired physicist Dr. Ralph B. Alexander is the author of Global Warming False Alarm and Science Un- der Attack: The Age of Unreason. With a PhD in physics from the University of Oxford, he is also the author of numerous scientific papers and reports on complex technical issues. His thesis research in the interdisciplinary area of ion-solid interactions reflected his interest in a wide range of scien- tific topics.

Dr Alexander has been a researcher at major laboratories in Europe and Australia, a professor at Wayne State University in Detroit, the co-founder of an entrepreneurial materials company, and a market analyst in environmentally friendly materials for a small consulting firm.

Egg on Their Faces: 10 Climate Alarmist Predictions for 2020 That Went Horribly Wrong

by T. O’Neil, Dec 28, 2020, in PJMedia


Long before Beto O’Rourke claimed the world only had 10 years left for humans to act against climate change, alarmists had spent decades predicting one doomsday scenario after another, each of which stubbornly failed to materialize. It seems climate armageddon has taken a permanent sabbatical.

Many of those doomsday predictions specifically mentioned the annus horribilus of 2020. Those predictions also failed, some rather spectacularly.

Steve Milloy, a former Trump/Pence EPA transition team member and founder of JunkScience.com, compiled ten climate predictions for 2020 that fell far off the mark.

1. Average global temperature up 3 degrees Celsius

10. Glaciers gone at Glacier National Park

In March 2009, U.S. Geological Survey ecologist Daniel Fagre predicted that the glaciers in Montana’s Glacier National Park would disappear by 2020.

Wrong Again: 2020’s Failed Climate Doomsaying

by C. Rotter, Dec 18, 2020 in WUWT


Reposted from JunkScience.com

2020 has been the wildest and most unpredictable year in the memory of most people. But did the climate doom that was predicted to occur in or by 2020 materialize? What follows are 10 predictions made for 2020 and what really happened. As it turns out, climate doomsayers weren’t seeing so 20-20 when it came to 2020.

….

No, It Was Not A Record Hurricane Season!

by P. Homewood, Dec 3, 2020 in NotaLotofPeopleKnowThat


Inevitably the busy hurricane season this year is getting blamed on global warming:

But first of all, let’s get one thing clear – there was not a record number of hurricanes this year in the Atlantic. There were 13 hurricanes, compared to 15 in 2005:

https://www.aoml.noaa.gov/hrd-faq/#tcs-after-1930


It is true that there were more named storms, which includes tropical storms as well as hurricanes, this season than in any other year, but this is quite meaningless. Over the years, reporting practices have drastically changed, so that more storms are spotted and named now.


Why lockdown had little to no effect on global temperatures

by A.N. Archer & J.Weber, Oct 22, 2020 in Phys.Org


Countries across the world took unprecedented action in the first few months of 2020 to control the spread of COVID-19. At its peak, one-third of the world’s population was in lockdown. Around the world, car travel fell by 50%, the number of flights plummeted by 75% and industrial activity fell by around 35%.

With so many cars parked, airplanes grounded and factories closed, global carbon dioxide (CO₂) emissions fell by around 17% compared with the same period in 2019. But greenhouse gases such as CO₂ weren’t the only emissions to fall, and not all pollution heats the planet. Some of the industrial activities that shut down—particularly heavy industry, including steel and cement making—also produced aerosols, which are that linger in the atmosphere for weeks and reflect heat from the Sun.

Previous studies have suggested that if a lot of these industrial processes were to suddenly shut down, it would lead to short-term warming because the atmosphere would lose the reflective effect of aerosols. But as the lockdown cleared skies, temperatures didn’t rocket.

In new research, we show that lockdown had a negligible effect on global temperatures. So what really happened?

NSIDC: 2020 POLAR ICE DOING JUST FINE

by Cap Allon, Oct 24, 2020 in Electroverse


According to the latest October report from the National Snow and Ice Data Center (NSIDC), the ice locked at Earth’s poles is, overall, GROWING.

By volume, Antarctica contains 90% of Earth’s ice, and volume is a far better metric to use when judging the state of an ice sheet than sea ice extent. Extent is prone to wild and unpredictable fluctuations due to natural changes in ocean currents and wind patterns, etc–though these fluctuations are of a much lesser degree in Antarctica than in its northern cousin, the Arctic.

According to the latest NSIDC report, Antarctic sea ice extent reached a whopping 18.95 million square kilometers (7.32 million square miles) on September 28. Mid to late Sept would usually give us the year’s maximum extent, but given the favorable conditions in October, the maximum may well be higher. “As is typical this time of year, there are wide swings caused by winds and storms along the extensive ice edge,” writes the NSIDC.

Ice extent around Antarctica is now “well above the 1981 to 2020 median extent,” the NSIDC informs us. “Ice extent is above the median extent along a broad area off the Wilkes Land coast and western Ross Sea, near the median extent from the Amundsen Sea clockwise to the Weddell Sea and above the median north of Dronning Maud Land, Enderby Land, and the Cosmonaut Sea. The only major area of below the median extent is in the Indian Ocean sector near the Amery Ice Shelf and eastward.”

Continuer la lecture de NSIDC: 2020 POLAR ICE DOING JUST FINE

LA NINA HAS ARRIVED: NEAR-TERM COOLING

by Cap Allon, Oct 11, 2020 in Electroverse


The following article is written by Bob Hoye of www.pivotaladvice.com.

Last week, the Global Warming policy Forum headlined “La Nina Is Here”. Why the headline? Because the warming El Nino is over and the change to the La Nina represents cooling. Like seasonal and actual climate change, it is a regular event. Which in physics means logical and predictable. And some cooling is showing up in various charts. Well, in those not altered by promoters of AGW.

An Unremarkable Summer

by P. Homewood, September 3, 2020 in NotaLotofPeopleKnowThat


Despite a few warm days in early August, the month as a whole was not unusually hot, a full 1.6C cooler than August 1995, according to the Central England Temperature series. Other hotter Augusts include 1911, 1947 and 1975.

It was even colder than 1736 and 1899.

Summer as whole was even less remarkable, ranking 51st, tied with years such as 1701, 1731 and 1780.

The summers of 1976 and 1826 remain the two hottest on record, well above anything seen since.

https://www.metoffice.gov.uk/hadobs/hadcet/data/download.html

by Cap Allon, August 7, 2020 in Electroverse


According to official government data from the National Snow & Ice Data Center (NSIDC), 2020’s Antarctic Sea Ice Extent is tracking the 1979-1990 average.

Climate alarmists take note, the ice locked within Antarctica is far more important to your hokey climate theories than that contained in its northern cousin the Arctic.

The Antarctic contains 90% of our planet’s ice, and, therefore, if Antarctica isn’t melting then any potential sea-level rise will be severely limited.

And Antarctica isn’t melting.

According to the latest NSIDC data, sea ice extent around the southern pole has been tracking the 1979-1990 average ALL YEAR:

[nsidc.org/arcticseaicenews/charctic-interactive-sea-ice-graph]

In addition, August 2020’s extent is currently greater than it was in the 1980s:

The Global CO2 lockdown problem

by Sherrington G., May 22, 2020 in WUWT


The global problem.

In response to the threat of a global viral epidemic, countries announced lockdowns at various times near 25th March 2020. https://en.wikipedia.org/wiki/COVID-19_pandemic_lockdowns

This caused a reduction of industrial activity and hence a lower rate of emission of anthropogenic carbon dioxide to the atmosphere. An example of reduction from aircraft is given at https://en.wikipedia.org/wiki/Impact_of_the_COVID-19_pandemic_on_aviation

Numerous sources asked if the reduction in CO2 emission could be detected in analysis of air for CO2 content, which had been done for decades. Early questions and speculative answers came from many sources including –

https://www.esrl.noaa.gov/gmd/ccgg/covid2.html

https://www.aljazeera.com/news/2020/03/coronavirus-lockdown-leads-improved-air-quality-200322094404592.html

By late May 2020, the emerging consensus was that the reduction would be too small to show at the main measuring stations such as Mauna Loa, Hawaii.

Earth’s Mean Temperature Falling, Planetary Alignment Suspected As Driver Of The 11-Year Solar Cycle

by F. Vahrenholt, May 9, 2020 in NoTricksZone


The global mean temperature in April 2020 was again significantly lower than in February and March, at 0.38°C above the average from 1981 to 2010. The average temperature increase on the globe from 1981 to February 2020 was 0.14°C per decade. The further development promises to be interesting, especially since a number of research institutes expect a higher probability of a cooling La Nina in the Pacific towards the end of the year. March’s solar activity was very low with a sunspot number of 1.5.  Activity in April rose slightly to 5.4. The first sunspots of the new cycle are showing.

What causes the sun to have an 11-year cycle?

Since the Dessau pharmacist Heinrich Samuel Schwabe discovered in 1843 that the sunspots of the sun increase and decrease in an 11-year cycle, science has been puzzling over the reason why this cycle lasts 11 years and why the solar magnetic field also changes its polarity in this rhythm: the north pole becomes the south pole and vice versa.

In July last year, scientists at the Helmholtz Centre in Dresden Rossendorf made a little-noticed but exciting discovery. Every 11.07 years, the planets Venus, Earth and Jupiter are aligned quite precisely. At this point in time, their gravitational force acts jointly in one direction on the Sun.

Image: NASA Earth Observatory. Public Domain

PARTS OF UK AND US SUFFER THEIR LOWEST MAY TEMPERATURES ON RECORD

by  Cap Allon, May 14, 2020 in Electroverse


Parts of the UK and US have suffered their lowest May temperatures on record of late, according to data from filthy warm-mongers & partners-in-crime the Met Office and NOAA.

While the official li(n)e coming out of these agencies is that our World Is On Fire, thermometer stations the length and breadth of both Europe and North America are telling a rather different story.

Overnight Wednesday (May 13-14), the mercury in Katesbridge and Castlederg, N. Ireland, plummeted to an extra-duvet-grabbing -6.1C (21F) and -3.9C (25F), respectively, as a wave of brutal Arctic air rode anomalously-far south on the back on a meridional (wavy) jet stream flow.

Wednesday night followed what had been a record-chilly day — a minimum temperature of -5C (23F)was observed in Tulloch Bridge, Scotland.

The wave of record cold actually engulfed much of Northern Europe overnight Wednesday, as visible in coolwx.com‘s temperature animation:


EUROPE’S BIG SPRING FREEZE — ARCTIC BLAST TO GRIP THE CONTINENT DELIVERING SUB-ZERO TEMPERATURES AND RARE APRIL SNOW

by Cap Allon, March 27, 2020 in Electroverse


Latest GFS runs are forecasting a truly frosty and snowy next 7+ days for the majority of Europe, as winter continues to encroach ever-further into spring — a phenomenon long-predicted by those who study the Sun’s impact on climate.

Beginning this weekend, brutal Arctic cold will engulf practically ALL of Europe sinking temperatures some 16C below-the-seasonal-average for many:

…and there’s plenty more where that came from.

GFS runs are predicting rare April snow accumulating during the next 14-or-so days, particularly in Norway, Sweden, NE Russia, Latvia, Lithuania, Belarus, Ukraine, the Balkans, Italy, the Alps, Spain, and even the UK (also, note the substantial falls in Eastern Turkey, Georgia, Armenia and Azerbaijan):


Past civilizations shown to peak during times of warmth (Grand Solar Maximums), and then almost-instantly collapse during the subsequent & sharp cool-downs (Grand Solar Minimums).

And these COLD TIMES are returning, in line with historically low solar activitycloud-nucleating Cosmic Rays, and a meridional jet stream flow.

Even NASA agrees, in part at least, with their forecast for this upcoming solar cycle (25) revealing it will be “the weakest of the past 200 years,” with the agency correlating previous solar shutdowns to prolonged periods of global cooling here.

North Atlantic Oscillation

by P. Homewood, March 19, in NotaLotofPeopleKnowThat


If you had not noticed (!), it has been a mild and wet start to the year here in the UK, and also across in NW Europe.

No doubt this will be linked to global warming in due course, but in fact it is simply weather, as the CET chart below proves:

Since the year started, temperatures have consistently been within the normal band. In other the sort of temperatures commonly seen at this time of year.

However, they have also been consistently in the top half of that band, rather than being spread between cold and warm, as would happen most years.

The reason for the weather we have had is, of course, the jet stream, or more precisely the North Atlantic Oscillation (NAO), which has been strongly and stubbornly positive all winter.

The Norwegian Centre for Climate Research CICERO spotted this mild weather coming back in December, and commented on 6th January:

The unusual warm temperatures this winter and forecasts indicating milder winter conditions for January, February and March in Europe are partly due to an atmospheric circulation pattern called the North Atlantic Oscillation, or NAO. This atmospheric circulation pattern explains well the weather we get in Europe, especially in winter.

https://cicero.oslo.no/no/posts/nyheter/unseasonal-temperatures-for-norway#


Our own Met Office explains the NAO phenomenon:


In 2020, Climate Science Needs To Hit The Reset Button (Part I)

by R. Pielke JR., December 23, 2019 in ClimateChangeDispatch


In a remarkable essay last week titled, “We’re Getting a Clearer Picture of the Climate Future — and It’s Not as Bad as It Once Looked,” David Wallace-Wells of New York Magazine wrote, “the climate news might be better than you thought. It’s certainly better than I’ve thought.”

The essay was remarkable because Wells, a self-described “alarmist,” is also the author of The Uninhabitable Earth, which describes an apocalyptic vision of the future, dominated by “elements of climate chaos.”

According to Wallace-Wells, his new-found optimism was the result of learning that much discussion of climate change is based on extreme but implausiblescenarios of the future where the world burns massive amounts of coal.

The implausibility of such scenarios is underscored by more recent assessments of global energy system trajectories of the International Energy Agency and United Nations, which suggest that carbon dioxide emissions from the burning of fossil fuels will be relatively flat over the next several decades, even before aggressive climate policies are implemented.

Scenarios of the future have long sat at the center of discussions of climate science, impacts and adaptation and mitigation policies.

Scenario-planning has a long history and can be traced to the RAND Corporation during World War 2 and, later (ironically enough) Shell, a fossil fuel company.

Scenarios are not intended to be forecasts of the future, but rather to serve as an alternative to forecasting. Scenarios provide a description of possible futurescontingent upon various factors, only some of which might be under the control of decision-makers.