by K. Richard, November 14, 2019 in NoTricksZone
It’s been acknowledged by mainstream scientists for years now that at certain locations on planet Earth, rising carbon dioxide levels cause cooling. It’s now been determined that rising CO2 also causes “negligible” cooling (or warming) depending on the season.
A few years ago a seminal paper (Schmithüsen et al., 2015) was published in Geophysical Research Letters that indicated raising the concentration of CO2 causes a negative greenhouse effect, or cooling, in central Antarctica.
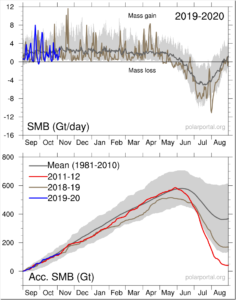
The forcing from the CO2 greenhouse effect ranges from -2.9 W/m² to +1 W/m², and the forcing for the Arctic (central Greenland) is said to be “comparably weak”.
…