Archives par mot-clé : TSI

Terrestrial temperature, sea levels and ice area links with solar activity and solar orbital motion

by V. Zharkova & I. Vasilieeva, Nov 2023


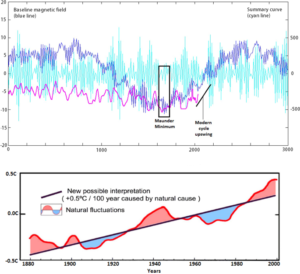
Abstract: This paper explores the links between terrestrial temperature, sea levels and ice areas in both hemispheres with solar activity indices expressed through averaged sunspot numbers together with the summary curve of eigen vectors of the solar background magnetic field (SBMF) and with changes of Sun-Earth distances caused by solar inertial motion resulting from the gravitation of large planets in the solar system.

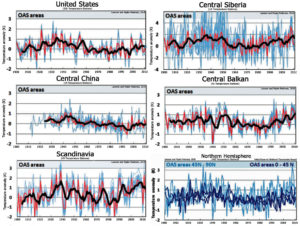
Using the wavelet analysis of the GLB  and HadCRUTS datasets two periods: 21.4  and 36 years in GLB, set   and the period of about 19.6 years  in the HadCRUTS are discovered. The 21.4 year period is associated with variations in solar activity defined by the summary curve of the largest eigen vectors of the SBMF. A dominant 21.4-year period is also reported in the variations of the sea level, which is linked with the period of 21.4 years detected in the GLB temperature and the summary curve of the SBMF variations.  The wavelet analysis  of ice and snow areas shows that  in the Southern hemisphere it does not show any links to solar activity periods while in the Northern hemisphere the ice area  reveals  a period of 10.7 years equal to a usual solar acitviity cycle.

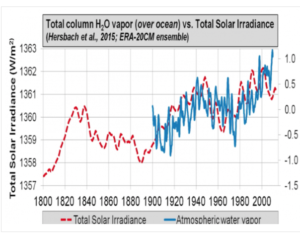
The TSI in March-August of every year  is found  to grow with every year following closely the temperature curve, because the Sun moves  closer to the Earth orbit owing to gravitation of large planets. (solar inertial motion, SIM). While the variations of solar radiation during a whole year have  more steady distribution without  a sharp TSI increase  during the last two centuries. The additional TSI contribution caused by SIM is likely to secure the additional energy input and exchange between the ocean and atmosphere.


Link to pre-print:  https://solargsm.com/wp-content/uploads/2023/11/zharkova_tsi_nc_form_subm-1.pdf


The paper is accepted for publication.

Scientists: Climate Records ‘Correlate Well’ With Solar Modulation…A Grand Solar Minimum Expected By 2030

by K. Richard, November 11, 2019 in NoTricksZone


International and NASA solar scientists find their Total Solar Irradiance reconstruction extending to 1700 can “correlate well” with Earth’s global temperature records, including a positive net TSI trend during 1986-2008. A new Grand Solar Minimum is expected to commence during the 2030s.

Surface climate records that have been uncorrupted by coastal (ocean-air)/urbanization biases suggest there has been a long-term oscillation in temperature since 1900, with peaks during the 1920s-1940s and again during recent decades (Lansner and Pepke Pedersen, 2018).

Oscillations of the baseline of solar magnetic field and solar irradiance on a millennial timescale

by Zharkova V. V. et al., June  24, 2019 in Nature OPEN ACCESS


Abstract

Recently discovered long-term oscillations of the solar background magnetic field associated with double dynamo waves generated in inner and outer layers of the Sun indicate that the solar activity is heading in the next three decades (2019–2055) to a Modern grand minimum similar to Maunder one. On the other hand, a reconstruction of solar total irradiance suggests that since the Maunder minimum there is an increase in the cycle-averaged total solar irradiance (TSI) by a value of about 1–1.5 Wm−2 closely correlated with an increase of the baseline (average) terrestrial temperature. In order to understand these two opposite trends, we calculated the double dynamo summary curve of magnetic field variations backward one hundred thousand years allowing us to confirm strong oscillations of solar activity in regular (11 year) and recently reported grand (350–400 year) solar cycles caused by actions of the double solar dynamo. In addition, oscillations of the baseline (zero-line) of magnetic field with a period of 1950 ± 95 years (a super-grand cycle) are discovered by applying a running averaging filter to suppress large-scale oscillations of 11 year cycles. Latest minimum of the baseline oscillations is found to coincide with the grand solar minimum (the Maunder minimum) occurred before the current super-grand cycle start. Since then the baseline magnitude became slowly increasing towards its maximum at 2600 to be followed by its decrease and minimum at ~3700. These oscillations of the baseline solar magnetic field are found associated with a long-term solar inertial motion about the barycenter of the solar system and closely linked to an increase of solar irradiance and terrestrial temperature in the past two centuries. This trend is anticipated to continue in the next six centuries that can lead to a further natural increase of the terrestrial temperature by more than 2.5 °C by 2600.

55 New (2019) Scientific Papers Link Solar Activity To Climate Change

by K. Richard, October 3, 2019 in NoTricksZone


In the last few years, hundreds of peer-reviewed scientific papers have been published linking changes in solar activity to Earth’s climate (2016, 2017, 2018). The evidence for a robust Sun-Climate connection continues to accumulate in 2019.

When it comes to the Sun’s influence on climate, one conclusion is certain: there is no widespread scientific agreement as to how and to what extent solar activity and its related parameters (i.e., galactic cosmic rays, geomagnetic activity, solar wind flux) impact changes in the Earth’s temperature and precipitation.

The disagreement is so chasmic and the mechanisms are so poorly understood that scientists’ estimates of the influence of direct solar irradiance forcing between the 17th century and today can range between a negligible +0.1 W m-2 to a very robust +6 W m-2 (Egorova et al., 2018Mazzarella and Scafetta, 2018).

There is no consensus on the amplitude of the historical solar forcingThe estimated magnitude of the total solar irradiance difference between Maunder minimum and present time ranges from 0.1 to 6 W/m2 making uncertain the simulation of the past and future climate.”  (Egorova et al., 2018)
“According to the IPCC (2013), solar forcing is extremely small and cannot induce the estimated 1.0–1.5 °C since the LIA. However, thesolar radiative forcing is quite uncertain because from 1700 to 2000 the proposed historical total solar irradiance reconstructions vary greatly from a minimum of 0.5 W/m2 to a maximum of about 6 W/m2 (cf..: Hoyt and Schatten 1993; Wang et al. 2005; Shapiro et al. 2011). Moreover, it is believed that the sun can influence the climate also via a magnetically induced cosmic ray flux modulation (e.g.: Kirkby 2007) or via heliospheric oscillation related to planetary resonances (e.g.: Scafetta 2013, 2014b; Scafetta et al. 2016, and others). Since solar and climate records correlate quite significantly throughout the Holocene (cf: Kerr 2001; Steinhilber et al. 2012; Scafetta 2012, 20104b), the results shown herein may be quite realistic, although the exact physical mechanisms linking astronomical forcings to climate change are still poorly understood.”  (Mazzarella and Scafetta, 2018)”

Why A ‘Super’ Grand Solar Minimum Is Upon Us

by Cap Allon, November 19, 2018 in PrincipiaScientificInternational


Professor Valentina Zharkova explains and confirms why a “Super” Grand Solar Minimum is upon us: “If the world was looking for an Epiphany moment, this should be it.”

Professor  Zharkova gave a presentation of her Climate and the Solar Magnetic Field hypothesis at the Global Warming Policy Foundation in October, 2018. Even if you believe the IPCC’s worst case scenario, Zharkova’s analysis blows any ‘warming’ out of the water.

Lee Wheelbarger sums it up: even if the IPCC’s worst case scenarios are seen, that’s only a 1.5 watts per square meter increase. Zharkova’s analysis shows a 8 watts per square meter decrease in TSI to the planet.

The information she unveiled should shake/wake you up. Zharkova was one of the few that correctly predicted solar cycle 24 would be weaker than cycle 23 – only 2 out of 150 models predicted this. Her models have run at a 93% accuracy and her findings suggest a SuperGrand Solar Minimum is on the cards beginning 2020 and running for 350-400 years.

‘Gimme Gimme Shock Treatment’

by Joe Bastardi, May 17, 2019 inThePatriotPost


Apparently, the new strategy to fight climate change is shock therapy. It’s like today’s environmental crusaders are channeling the Ramones song “Gimme Gimme Shock Treatment.” Here are some illustrations.

Shock treatment is for extreme measures. But take, for example, this Dr. Willie Soon plot of solar irradiance (a measure of solar energy) vs. water vapor:

Water vapor is the number-one greenhouse gas. So it’s no secret what temperatures do when water vapor increases.

Dr. Willie Soon versus the Climate Apocalypse

by WUWT, December 2, 2018


More honesty and less hubris, more evidence and less dogmatism, would do a world of good

Dr. Jeffrey Foss

“What can I do to correct these crazy, super wrong errors?” Willie Soon asked plaintively in a recent e-chat. “What errors, Willie?” I asked.

“Errors in Total Solar Irradiance,” he replied. “The Intergovernmental Panel on Climate Change keeps using the wrong numbers! It’s making me feel sick to keep seeing this error. I keep telling them – but they keep ignoring their mistake.”

Astrophysicist Dr. Willie Soon really does get sick when he sees scientists veering off their mission: to discover the truth. I’ve seen his face flush with shock and shame for science when scientists cherry-pick data. It ruins his appetite – a real downer for someone who loves his food as much as Willie does.