by Tony Heller, May 8, 2019 in ClimateChangeDispatch
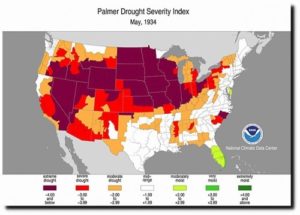
None of the US is currently experiencing severe drought. CO2 is at 410 ppm.
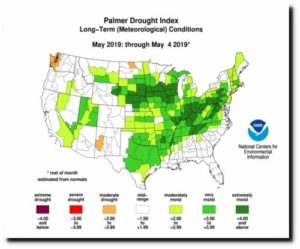
Compare with May 1934 – when half the US was experiencing severe or extreme drought. CO2 was 310 ppm.
…
by Tony Heller, May 8, 2019 in ClimateChangeDispatch
None of the US is currently experiencing severe drought. CO2 is at 410 ppm.

Compare with May 1934 – when half the US was experiencing severe or extreme drought. CO2 was 310 ppm.

…
by Donna Laframboise, May 8, 2019 in BigPictureNews
…
Apparently, those who currently trade in sand and gravel sometimes do so in an unsustainable manner. “[R]ules, practices and ethics” apparently differ worldwide. Imagine that. Moreover, “irresponsible and illegal extraction” needs to be curbed. In other words: the UN has now set its sights on this industry.
In the foreword to the 56-page Sand and Sustainability: Finding new solutions for environmental governance of global sand resources, Joyce Msuya, UNEP’s executive director, declares that humanity is “spending our sand ‘budget’ faster than we can produce it responsibly.”
While this report says it merely wants to spark a conversation, that it doesn’t intend to be “prescriptive,” Msuya’s remarks belie that. She advocates “improved governance of global sand resources,” talks about implementing global standards, and looks forward to the creation of brand new “institutions that sustainably and equitably manage extraction.” What’s another level of red tape, after all?
…

by Anthony Watts, May 2, 2019 in WUWT
At first, I thought this had to be a joke. Then I thought it must be some sort of misinterpretation. Sadly, no.
From the website Afrinik, quoting the book –Scener ur hjärtat by Malena Ernman, Svante Thunberg:
…
…
Of course, with a ~ 410 parts per million concentration of CO2 in the atmosphere, we know that is a physical impossibility. Carbon Dioxide is a colorless and odorless gas:
Source:
http://www.ces.fau.edu/nasa/module-2/how-greenhouse-effect-works.php
by Nathalie Sauer, April 30, 2019 in ClimateHomeNews
Mayor unveils plan aiming for 100% zero-emissions vehicles by 2050 amid sweeping climate package for the city
Los Angeles’ car-choked arteries will run clean within decades, according to a green reform package unveiled by mayor Eric Garcetti on Monday.
Speaking only a week after New York City mayor Bill de Blasio announced his own framework climate legislation, Garcetti presented plans to revolutionise local car culture and green the city’s buildings, which together account for three-quarters of LA’s emissions.
“Los Angeles needs to lead, but the whole world needs to act. This plan gives us a fighting chance,” Garcetti told the Los Angeles Times. “It’s sort of a ‘greenprint’ for every other city in the country and the world, hopefully.”
The legislation, which builds upon a previous 2015 sustainability plan, calls on the city to hike its percentage of zero emission vehicles from 1.4% in 2018 to 25% by 2025, 80% by 2035 and 100% by 2050. To do this, the City Town Hall intends to raise its number of publicly available electric-vehicle chargers from 2,100 to 28,000.
…
by Drieu Godefridi, 2 mai 2019 in Contrepoints
Réduire le réchauffement global sur Terre de 1,5° ? Dans un récent rapport, le Giec échafaude quatre scénarios pour y parvenir. Mais aucun d’eux ne tient la route.
es quatre scénarios mettent en œuvre à des degrés divers les techniques dites de Carbon Dioxide Removal (CDR), qui compensent les émissions humaines de CO2. Écoutons les experts « scientifiques » du GIEC — dont la plupart ne sont pas scientifiques. Lisons les experts du GIEC :
…
by Hans Schreuder, April 29, 2019 in ClimateChangeDispatch
For the past 30 years, there has been an orchestrated alarm over how much a trace of a trace gas, human-produced carbon dioxide (CO2), impacts earth’s climate.
The idea was presented as the ‘settled science’ and that there exists a ‘greenhouse effect’ in Earth’s atmosphere and that CO2 ‘traps heat’ or ‘delays cooling’.
Besides the ‘official scientists’ who have convinced the world that there really is a problem, there are what I call the pseudo-skeptics, a large group that is more widely known as ‘Lukewarmists’.
They include many professors who don’t disagree that the trace gas CO2 must be causing ‘some’ warming but think it is so small it isn’t worth worrying about.
This group also fully backs the greenhouse gas theory and claims CO2 warming is logarithmic (i.e., determined on a sliding scale of positive water vapor feedback – see this post from WUWT with reader comments and the subsequent confusion).
…
by Katy Grimes, April 22, 2019 in CaliforniaGlobe
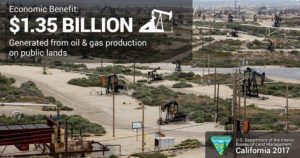
The “Keep it In the Ground,” anti-oil and gas industry movement is going after the industry with more legislation disguised to address health and local control issues, despite that California already has the most environmentally regulated oil and gas production in the world, regulated by more than 25 agencies.
“Keep It in the Ground” is a global protest movement opposing fossil fuel development.
California was the fourth-largest producer of crude oil among the 50 states in 2017, after Texas, North Dakota, and Alaska, and, as of January 2018, third in oil refining capacity after Texas and Louisiana.
AB 345 by Assemblyman Al Muratsuchi (D-Torrance), would increase setback distance between oil production facilities and private and public property to 2,500 feet for every well, existing or planned in the state.
According to the Western States Petroleum Association and the California Independent Petroleum Association, this bill, if passed, would effectively end oil production in many parts of the state and threaten the future of production IN ALL PARTS OF THE STATE, for example:
87% of all wells in the City of Los Angeles would be shut in
66% of the well in Los Angeles County would be shut in
Thousands of wells in Kern County will be shut in
…
by Connaissance des Energies, 29 avril 2019
À RETENIR
- Les Small Modular Reactors (SMR) sont de petits réacteurs nucléaires réalisés en usines sous forme de modules.
- Leur puissance varie généralement entre 10 et 300 MW.
- Le déploiement des SMR est envisagé pour produire de l’électricité, en particulier dans des sites isolés, mais également pour des applications non électrogènes : chaleur, dessalement, production d’hydrogène, propulsion, etc.
- Fin 2018, on dénombre une cinquantaine de projets de SMR, avec de nombreuses technologies à l’étude.
…
Les modules SMR » de NuScale Power pèseront près de 700 tonnes et pourront être transportés par camion ou par barge. (Image provided by NuScale Power, LLC)
by Andrew Montford, April 23, 2019 in GWPF
Extinction Rebellion seem to be everywhere at the moment. And everywhere their story is the same. We are in the middle of a climate catastrophe. As the Huffington Post put it,
Human-caused climate change is driving sea-level rise, drought, extreme weather and a biodiversity crisis that scientists have declared Earth’s sixth mass extinction event. As many as 150 species die off each day.
Scary eh? Surely that’s enough to justify the odd street protest?
It was therefore interesting to see read some remarks from Richard Betts today. Professor Betts is the head of climate impacts at the Met Office, so his views in this area carry a certain amount of weight. Asked what he thought were the top three negative impacts of climate change that have “absolutely started”, he replied:
- Sea level rise
- Increasing risk of high temperatures
- Changes in phenology and distribution for numerous species
This left me agog. There was nothing about drought or hurricanes or any of the other manifestations of extreme weather that are said to be afflicting us; nothing about floods, or typhoons, or desertification or crashing crop yields or climate refugees, mass extinctions, skydiving walruses and any of the thousand and one tall tales that climate activists spin and the media faithfully repeat every day. The contrast between this take on currently observed negative impacts and David Attenborough’s risible Climate Change: the Facts programme last week is startling. The take home message is that most of what the “national treasure” told viewers about climate change was grubby insinuation rather than fact: less to do with science than with the BBC’s ongoing eco-campaign.
…
by William Ward, April 18, 2019 in WUWT
The world is drowning in articles about catastrophic sea level rise (SLR), reminding us that if the ice sheets melt, 260 feet of water will flood our coastal cities. We know that sea level today is 20-30 feet lower than it was at the end of the last interglacial period 120,000 years ago. We also know that sea level has risen 430 feet since the end of the last glacial maximum 22,000 years ago. Research shows this rise was not monotonic but oscillatory, and during periods over the past 10,000 years, sea level has been several meters higher than today. So, evidence supports the possibility of higher sea levels, but does the evidence support the possibility of catastrophic sea level rise from rapidly melting ice?
In this paper, basic science is used to show that catastrophic SLR from melting ice cannot happen naturally over a short period. Additionally, humankind does not possess the capability to melt a large amount of ice quickly even through our most advanced technology. This news should relieve the public, which is routinely deceived by reporting that misrepresents the facts. The public is susceptible to unnecessary alarmism when melt rates and ice-melt masses are presented without perspective and juxtaposed against claims that scientists are worried. This paper uses the same facts but places them in perspective to show that catastrophic risks do not exist.
…
by David Middleton, April 24, 2019 in WUWT
In Part One of this series, we looked at Peak Oil and its irrelevance to energy production and also discussed the relevance of Seinfeld. In Part Deux, we looked at “abiotic oil,” a real(ish) thing that really doesn’t matter outside of academic discussions and SyFy blogs.
Part Trois will explore perhaps the most meaningless notion to ever come out of academia: Energy Returned On Energy Invested (EROEI or EROI depending on spelling skill). EROEI is like what Seinfeld would have been if it was written by Douglas Adams.
…
by Nicolas Loris, April 22, 2019 in GWPF/BangorDailyNews
We should be thankful that the gloom-and-doom predictions made throughout the past several decades haven’t come true. Fear-mongering about explosive population growth, food crises and the imminent depletion of natural resources have been a staple of Earth Day events since 1970. And the common thread among them is that they’ve stirred up a lot more emotions than facts.
“By the year 2000, if present trends continue, we will be using up crude oil at such a rate … that there won’t be any more crude oil,” ecologist Kenneth Watt warned around the time of the first Earth Day event. “You’ll drive up to the pump and say, ‘Fill ’er up, buddy,’ and he’ll say, ‘I am very sorry, there isn’t any.’” Watt also warned of global cooling and nitrogen buildup rendering all of the planet’s land unusable.
…
by Eric Worrall, April 20, 2019 in WUWT
Guest essay by Eric Worrall
h/t Dr. Willie Soon; In climate science, when your model predictions are wrong, you wait for the world to correct itself.
…
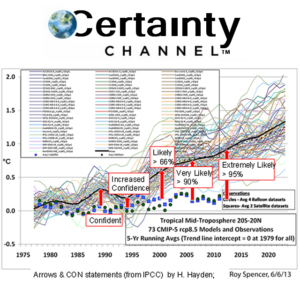
by Jim Steele, April 19, 2019 in WUWT
In 2010 Nunavut’s Minister of Environment Daniel Shewchuk wrote, “Inuit hunters have a close relationship with the land and wildlife. They have observed that the overall population of polar bears in Nunavut is not declining as some suggest, but rather is thriving. No known environmental or other factors are currently posing a significant or immediate threat to polar bears overall. Furthermore, Inuit knowledge and science corroborate that the species can and will adapt to changing and severe climatic conditions, as it has done for centuries.”
The Inuit truly practice the concept of “it takes a village”. Hunters sit down in kappiananngittuq and respectfully share their observations of wildlife and their movements. Kappiananngittuq is the Inuit word for a “safe place to discuss”. Based on community discussions, Inuit have steadfastly claimed it is “The Time of the Most Polar Bears”. Overhunting has been one of the world’s greatest threats to wildlife. And the growing number of polar bears is testimony to wise hunting regulations now honored by the Inuit.
…
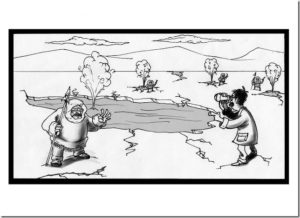
by GWPF, April 18, 2019

I have, so I researched how to identify a religious cult. Rick Ross, an expert on cults and intervention specialist,developed a list of ten warning signs for unsafe groups, which is published by the Cult Education Institute. So let’s take a look at all ten signs and compare:
…
by Prof. S. Furfari, April 4, 2019 in EuropeanScientist
The idea of replacing petroleum products with alternative fuels produced from agriculture dates back to the 1973 and 1979 oil crises. But apart from the development of bioethanol from cane sugar in Brazil, the idea had not come to fruition because it was not economically viable. It was the frenzy for some kind of sustainable development in the mid-2000s, combined with a perfect storm of realities, that led to the emergence of a political interest in biofuels.
…

by University of Utah, April 14, 2019 in WUWT
Proteins help organisms form or inhibit ice crystals
Contrary to what you may have been taught, water doesn’t always freeze to ice at 32 degrees F (zero degrees C). Knowing, or controlling, at what temperature water will freeze (starting with a process called nucleation) is critically important to answering questions such as whether or not there will be enough snow on the ski slopes or whether or not it will rain tomorrow.
Nature has come up with ways to control the formation of ice, though, and in a paper published today in the Journal of the American Chemical Society University of Utah professor Valeria Molinero and her colleagues show how key proteins produced in bacteria and insects can either promote or inhibit the formation of ice, based on their length and their ability to team up to form large ice-binding surfaces. The results have wide application, particularly in understanding precipitation in clouds.
“We’re now able to predict the temperature at which the bacterium is going to nucleate ice depending on how many ice-nucleating proteins it has,” Molinero says, “and we’re able to predict the temperature at which the antifreeze proteins, which are very small and typically don’t work at very low temperatures, can nucleate ice.”
…
by Ed Yong, April 8 , 2019 in TheAtlantic
In the autumn of 2017, about 250 walruses in Russia, having climbed up to rocky slopes overlooking a beach, just walked over the edge.
Usually, gravity is no enemy of the walrus. When these animals encounter hard surfaces, they rise up to meet them, hauling their two-ton bulks onto floating pieces of ice. When they fall, they flop off those low platforms into the accommodating water. So you might imagine that a walrus, peering off a tall cliff, doesn’t really understand what will happen to it when it steps off. It doesn’t expect to plummet for 260 feet, cartwheel through the air, bounce off the rocks, and crash abruptly. Climb, plummet, cartwheel, bounce: These are not walrus-associated verbs.
…

A walrus falls from a cliff overlooking a Russian beach.SOPHIE LANFEAR
by P. Homewood, April 13, 2019 in NotaLotofPeopleKnowThat
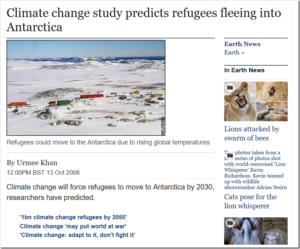
Climate change will force refugees to move to Antarctica by 2030, researchers have predicted.
Among future scenarios are the Olympics being held in cyberspace and central Australia being abandoned, according to the think tank report.
Forum for the Future, a research body committed to sustainable development, said they wanted to stir debate about how to avert the worst effects of global warming by presenting a radical set of ‘possible futures’.
There will be a shift towards greater energy efficiency, where desalination plants will run on solar power will turn the Sahara green.Refugees are expected to move to Antarctica because of the rising temperatures that will see the population of the continent increase to 3.5 million people by 2040.
As the world fails to act on climate change, researchers predict that global trade will collapse as oil prices break through $400 a barrel and electrical appliances will get automatically turned off when households exceed energy quotas.
…
…
by T.M. Bonnicksen, November 12, 2018 in San FranciscoChronicle
The reason wildfires are burning California with unprecedented ferocity this year is because our public forests are so thick. It is our fault. We don’t manage our forests, we just let them grow. That is the simple truth. However, it is easier to deny the truth and blame a warming climate instead of admitting our guilt and taking action to prevent wildfires.
Hot, dry weather doesn’t cause catastrophic wildfires. It only makes them worse. In order for any fire to burn, it must have fuel. To spread wildly, it must have abundant fuel. Efforts in the 20th century to prevent fire and preserve forests have been too successful — they have disrupted the ecological balance and allowed more and more trees to grow.
…
by Tony Heller, April 12, 2019 in ClimateChangeDispatch
A quarter-century ago, the world’s leading climate experts predicted the end of skiing.
The exact opposite has occurred. Ski areas are receiving record snow and some are staying open all year round.
It wasn’t always like this though. In 1932, the Winter Olympics almost had to be canceled because of a lack of snow.
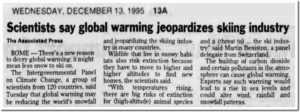
13 Dec 1995, Page 13 – The Times at Newspapers.com
…
by Graham Lloyd, April 10, 2019 in ClimateChangeDispatch
Netflix’s acclaimed Our Planet series has come under fire for “tragedy porn” over images of walruses falling to their deaths from cliff tops, allegedly because of climate change.
The Our Planet footage, narrated by David Attenborough, showed dozens of the animals climbing up 80-meter-high outcrops in northeast Russia because of a lack of sea ice.
They were shown plunging onto the rocks below, with hundreds of dead animals piled on the shoreline. A voice-over by Attenborough claimed their poor eyesight made it hard for them to return safely to the ocean.
But a Canadian zoologist has dismissed the claims as “contrived nonsense” and said the walruses were most likely driven over the cliffs by polar bears.
Susan Crockford, of the University of Victoria in British Columbia, Canada, told The Telegraph UK: “This powerful story is fiction and emotional manipulation at its worst.”
The polar bear expert said that at the time the footage was shot in 2017 at Kozhevnikova Cape, Ryrkaypiy, in eastern Russia, the town was being besieged by polar bears.
According to The Siberian Times, 20 bears had surrounded the town, attracted by 5,000 walruses that had appeared at a local protection zone.

…
by David Middleton, April 10, 2019 in WUWT
Alternate title:
No… “The biggest Saudi oil field is [NOT] fading faster than anyone guessed”… Part Trois: Why Peak Oil Is Irrelevant and the Perpetually Refilling Abiotic Oil Field Is Abject Nonsense
Saudi Aramco’s recent bond prospectus has generated a lot of media buzz, particularly regarding the production from Ghawar, the largest oil field in the world. Reaction has ranged from “The biggest Saudi oil field is fading faster than anyone guessed,” (not even wrong) to more subdued reactions from Ellen Wald and Robert Rapier, that the prospectus doesn’t really tell us much Ghawar’s decline rate. One thing that the bond prospectus did do, is to paint a picture of the most profitable company in the world and one that is serious when it says it will produce the last barrel of oil ever produced on Earth.
How big is Ghawar? Has it peaked? Is it “fading faster than anyone guessed”? The answer to the first question is: FRACKING YUGE. The answer to the second question was not easily answerable before Saudi Aramco began the process of becoming a publicly traded company. The answer to the third question is: Of course not.
As Saudi Aramco proceeds towards a 2021 IPO, it has had to embrace transparency. This involved an audit of the proved reserves in their largest fields, comprising about 80% of the company’s value. The audit was conducted by the highly respected DeGolyer and MacNaughton firm (D&M). The audit actually determined that the proved reserves are slightly larger than Aramco’s internal estimate.
…
by J. Curry and J. Johnstone, April 9, 2019 in WUWT
CFAN’s 2019 ENSO forecast is for a transition away from El Niño conditions as the summer progresses. The forecast for Sept-Oct-Nov 2019 calls for 60% probability of ENSO neutral conditions, with 40% probability of weak El Niño conditions. – Forecast issued 3/25/19
Introduction
CFAN’s early season ENSO forecast is motivated by preparing our seasonal forecast for Atlantic hurricane activity. ENSO forecasts made in spring have traditionally had very low skill owing to the ENSO ‘spring predictability barrier.’
During fall 2018, there was warming in the Central Equatorial Pacific, leading to a weak El Niño Modoki pattern, which impacted the latter part of the Atlantic hurricane season. This transitioned to a weak (conventional) El Niño in February 2019 and the atmospheric anomalies became more consistent with a conventional El Niño pattern.
NOAA’s latest forecast: Weak El Niño conditions are likely to continue through the Northern Hemisphere spring 2019 (~80% chance) and summer (~60% chance).
CFAN’s ENSO forecast analysis is guided by the ECMWF SEAS5 seasonal forecast system and a newly developed statistical forecast scheme based on global climate dynamics analysis.
ENSO statistics
…
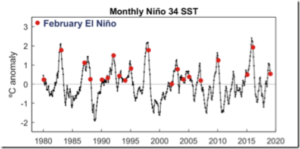
Figure 1 illustrates the recent ENSO history as depicted by monthly Niño 3.4 anomalies from 1980 to February 2019.
by J.S. Goldstein et al., April 6, 2019
As young people rightly demand real solutions to climate change, the question is not what to do — eliminate fossil fuels by 2050 — but how. Beyond decarbonizing today’s electric grid, we must use clean electricity to replace fossil fuels in transportation, industry and heating. We must provide for the fast-growing energy needs of poorer countries and extend the grid to a billion people who now lack electricity. And still more electricity will be needed to remove excess carbon dioxide from the atmosphere by midcentury.
…
