Archives par mot-clé : CO2 Sensivity

German Researcher: Doubling Of Atmospheric CO2 Causes Only 0.24°C Of Warming …Practically Insignificant

by P. Gosselin, Nov 19, 2024 in NoTricksZone


The CO2 scam and “climate denial”

German researcher concludes CO2 warming immensely exaggerated…. IR radiation of clouds considerably reduces the greenhouse effect of CO2.”

The prosperity and political stability of our countries are in grave danger. The reason for this is an ideology that claims catastrophic climate change caused by the alleged “greenhouse gas” CO2 and is intent to destroy our civilization and prosperity. Its supporters are spreading a witch-hunt atmosphere against anyone who questions their ideology. So-called “climate deniers” are also denied any scientific expertise.

Every Swiss person can already see the first financial consequences on their electricity bill: In this country, the price of a kilowatt hour has shot up by up to 300% for some households in just four years. And this is just the beginning, as the Swiss government is pursuing the goal of switching to solar and wind power and thus to sources that cost 20 instead of 6 rp/kWh.

Conclusions

In his summary, Prof. Reinhart comes to the following conclusions:

“- The heat retention (“forcing”) by atmospheric carbon dioxide (CO2 ) causes a maximum temperature increase of 0.24 K (0.24°C) when the concentration doubles from 400 ppm to 800 ppm, based on a simplified absorption model that is independent of climate.

– This value depends only on the accepted mean earth temperature, T = 288 K, and is relatively insensitive to its uncertainty of 2 K.

– The temperature increase since the industrial revolution amounts to a maximum of 0.12 K, which is within the range of measurement accuracy. The anthropogenic contribution is therefore practically insignificant.

– The behavior of glacial and current temperature trends is not causally linked to carbon dioxide concentrations.

– The causes of global warming have not been clarified. However, they are most likely linked to the solar system and the water cycle.

– Measures to control CO2 emissions and the earth’s temperature are unsuitable, even dangerous means”.

New Paper: Objective Measurements Show CO2’s Effect On Warming Not As Large As Modeled

by Dr R. Spencer, Sep 29, 2023 in ClimateChangeDispatch


A new research study from The University of Alabama in Huntsville, a part of the University of Alabama System, addresses a central question of climate change research: how much warming can be expected from adding carbon dioxide to the atmosphere through fossil fuel burning and other activities as standards of living increase around the world? [emphasis, links added]

UAH Earth System Science Center Research Scientist Dr. Roy Spencer and UAH Earth System Science Center Director and Alabama State Climatologist Dr. John R. Christy have spent 10 years developing a one-dimensional climate model to answer this elusive question.

Their latest research study was published in the September 2023 issue of Theoretical and Applied Climatologyjournal titled: “Effective climate sensitivity distributions from a 1D model of global ocean and land temperature trends, 1970–2021.”

Spencer and Christy’s climate model, based upon objective measured data, found carbon dioxide does not have as big of an effect on the warming of the atmosphere when compared with other climate models.

“For over 30 years, dozens of highly sophisticated, computerized climate models based upon theory have been unable to agree on an answer. That’s why we developed our own one-dimensional climate model to provide an answer,” says. Dr. Spencer.

Current climate models range over a factor of three, from 1.8 to 5.6° Celsius, in the amount of warming produced in response to a doubling of atmospheric carbon dioxide (CO2).

This warming response to doubled carbon dioxide is called “effective climate sensitivity.” Determining its magnitude has remained elusive for decades.

When compared to other current climate models, the research results from Spencer and Christy’s one-dimensional climate model approached the bottom end of the range, 1.9° Celsius.

The lower UAH value indicates that the climate impact of increasing carbon dioxide concentrations is much less [than] that based on other climate models.

An important assumption of our model, as well as the more complex models used by others, is that all climate change is human-caused,” Spencer states. “If recent warming is partly natural, it would further reduce climate sensitivity.”

What distinguishes this model developed at UAH from others is that it is driven by actual observations of warming, rather than theoretical assumptions about how the climate system responds to increasing greenhouse gases.

The one-dimensional climate model uses a variety of observational datasets of warming between 1970 and 2021 of the deep ocean and land, along with associated uncertainty ranges.

These datasets produced a range of estimates of climate sensitivity based on basic concepts of energy conservation.

“The 52-year period since 1970 is key. It represents the period of most rapid warming, with the highest confidence in the observational data of deep ocean warming,” Spencer states.

The results of Spencer and Christy’s research also showed a period of the most rapid growth in atmospheric carbon dioxide.

This is due to their climate model accounting for heat storage in deeper layers of land, which other climate models ignore.

A critical advantage of their simple model is that it conserves energy.

“It should be a requirement that any physics-based model of global warming should meet,” Spencer says. “Current computerized climate models continue to have difficulty achieving this aspect.

The model is simple enough that other scientists can easily adapt it to updated or improved global temperature measurements as they become available.

Nearly 140 Scientific Papers Detail The Minuscule Effect CO2 Has On Earth’s Temperature

by K. Richard, Jan 13, 2022 in  NoTricksZone


We have updated our “Extremely Low CO2 Climate Sensitivity” scientific paper list with new papers added from 2021 and some newly discovered papers from the past.

As of 2016 this list had only 50 papers on it (as indicated by the web address). In less than 6 years the list has grown to 137 (as of today).

Click on the link for the full list.

135+ Papers Find Extremely Low CO2 Climate Sensitivity

A few of the sample papers are shown here.

Coe et al., 2021 (2XCO2 [400 to 800 ppm] = 0.5°C)

The HITRAN database of gaseous absorption spectra enables the absorption of earth radiation at its current temperature of 288K to be accurately determined for each individual atmospheric constituent and also for the combined absorption of the atmosphere as a whole. From this data it is concluded that H2O is responsible for 29.4K of the 33K warming, with CO2 contributing 3.3K and CH4 and N2O combined just 0.3K. Climate sensitivity to future increases in CO2 concentration is calculated to be 0.50K, including the positive feedback effects of H2O, while climate sensitivities to CH4 and N2O are almost undetectable at 0.06K and 0.08K respectively. This result strongly suggests that increasing levels of CO2 will not lead to significant changes in earth temperature and that increases in CH4 and N2O will have very little discernable impact.

Climate Sensitivity to CO2, what do we know? Part 2.

by A. May, July 8, 2021 in WUWT


In Part 1, we introduced the concepts of climate sensitivity to CO2, often called ECS or TCR. The IPCC prefers a TCR of about 1.8°C/2xCO2 (IPCC, 2013, p. 818). TCR is the short-term, century scale, response of surface temperature to a doubling of CO2, we abbreviate the units as “°C/2xCO2.” In these posts we review lower estimates of climate sensitivity, estimates below 1°C/2xCO2. In parallel, we also review estimates of the surface air temperature sensitivity (SATS) to radiative forcing (RF, the units are °C per W/m2 or Watts per square meter). The IPCC estimates this value to be ~0.49°C per W/m2.

The previous post discussed two modern climate sensitivity estimates, by Richard Lindzen and Willie Soon, that range below 1°C/2xCO2. Next, we review climate sensitivity estimates by Sherwood Idso, Reginald Newell and their colleagues.

Many comments to part 1 tried to discredit the “ECS” or “TCR” estimates made by Lindzen and Soon, completely missing their point and my point. ECS and TCR are artificial climate model constructs, with little meaning outside the confines of computer modeling. TCR is a little more realistic since we might be able to observe or measure something close to it over the next century. But ECS, or the “Equilibrium Climate Sensitivity” is a totally abstract and unworldly number that could never be measured. It means if CO2 doubled suddenly, and nothing else changed for several hundred years while the oceans came into equilibrium with the new surface air temperature, what would the final surface temperature be? Air temperature would never be close to equilibrium for several hundred years, even 70 to 100 years (TCR) is a stretch.

Climate models are not the real world and the numbers that come out of them, like ECS or TCR, can be useful for showing the likely direction of temperature movement in response to changes in parameters or different model scenarios, but the numbers themselves are meaningless unless the models have previously been validated against the real world. With the possible exception of the Russian INM-CM4 model, no other IPCC model has successfully predicted future global surface temperatures. Ron Clutz discusses INM-CM4 here.

Model calculations are not observations. ECS and TCR are not real numbers, real numbers are based on observations. Thus, the model extracted values of ECS and TCR are not information, they can be used to detect the direction of change in climate forcing, if the climate model is an accurate reflection of that portion of the real world. The direction of movement of ECS and TCR, when model parameters or data tables change, is the information, not the computed value. I’m often amazed, as a former petrophysical modeler of 42 years, how often otherwise intelligent people confuse unvalidated model calculations with observations.

Modern Climate Change Science

by A. May, Nov 12, 2020 in WUWT


The first modern theoretical estimates of ECS were reported in 1979 in the so-called “Charney Report” (Charney, et al., 1979). They reported, on page 2, a theoretical ECS of 1.5°C to 4.5°C per doubling of the CO2 atmospheric concentration. This estimate included an estimate of water vapor feedbacks, the effect of ice and their assumed uncertainties. Absent any water vapor feedback their computed value was 1°C per doubling of CO2. They also supply a likely value of 2.4°C on page 9, although on page 2 they offer a value “near 3.0.” The page 9 value is not far off from the empirical estimate of 2°C made by Guy Callendar in 1938, but significantly higher than the 1.2°C to 1.95°C (17% to 83% range, best estimate 1.5°C) given by Nic Lewis and Judith Curry (Lewis & Curry, 2018).

The IPCC, in their AR5 report (Bindoff & Stott, 2013), estimate ECS as lying between 1.5°C and 4.5°C and provide no best estimate. This range is precisely the same as the Charney Report made 34 years earlier. While the empirical, observation-based, estimates have narrowed significantly, the theoretical range has not changed, despite thousands of government-funded scientists spending billions of dollars trying to do so. The data is very much the same today and churning it faster with more powerful computers and billions of dollars doesn’t seem to matter. It works the same way with manure.

Digging deeply into the AR5 internals, as Monckton, et al. did in MSLB15, a paper entitled, “Why Models run hot: results from an irreducibly simple climate model” (Monckton, Soon, Legates, & Briggs, 2015), we see that the elements of the AR5 theoretical calculations suggest that the range is narrowing in a downward direction. Given the political environment at the IPCC, one can easily suspect that the politicians do not want to admit the theoretical risks of CO2-caused climate change are lessening. As more empirical estimates of the CO2 effect appear and more theoretical work is done, one wonders how long the politicians can support the clearly inflated range of 1.5°C to 4.5°C?

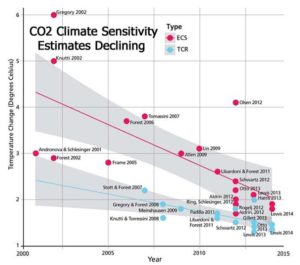
Estimates of ECS have been declining for a long time, as shown in 2017 by Nicola Scafetta and colleagues. Figure 1 is from their paper:

The decline in estimates of ECS from 2000 to 2015. Source: Scafetta, Mirandola, and Bianchini, 2017.