Scientists announced today that a core drilled in Antarctica has yielded 2.7-million-year-old ice, an astonishing find 1.7 million years older than the previous record-holder
(…)
If the new result holds up, says Yige Zhang, a paleoclimatologist at Texas A&M University in College Station, the proxies will need to be recalibrated. “We have some work to do.”
Specifically the Bureau of Land Management Health Risk Evaluation for Cabon Dioxyde points out:
A value of 40,000 ppm is considered immediately dangerous to life and health based on the fact that a 30-minute exposure to 50,000 ppm produces intoxication, and concentrations greater than that (7-10%) produce unconsciousness (NIOSH 1996; Tox. Review 2005). Additionally, acute toxicity data show the lethal concentration low (LCLo) for CO2 is 90,000 ppm (9%) over 5 minutes (NIOSH 1996).
Earth’s most severe mass extinction, the “Great Dying,” began 251.94 million years ago at the end of the Permian period, with the loss of more than 90% of marine species. Precise rock dates published in 2014 and 2015 proved that the extinction coincided with the Siberian Traps LIP, an epic outpouring of lava and intrusions of underground magma covering an area of northern Asia the size of Europe.
But those rock dates presented science with a new puzzle: why was the mass extinction event much shorter than the eruptions? And why did the extinction happen some 300,000 years after the lava began to flow?
Not surprisingly, when all was said and done, the authors report that “increasing [the] CO2 concentration to 3000 ppm at 35°C did not cause changes in any of the measured responses.” They did note, however, that the heart rates of the subjects were slightly reduced under elevated CO2 conditions (Figure 1, top left panel), although these reductions were not statistically significant.
Since 1988, a mere 100 companies have been responsible for 71 percent of the entire world’s industrial greenhouse gas emissions.
This data comes from an inaugural report published by the Carbon Disclosure Project (CDP), an environmental non-profit. Charting the rapid expansion of the fossil fuel industry in the last 28 years, they have now released some truly staggering numbers on the world’s major carbon polluters.
Today ‘warm’ is strongly connected with ‘climate change’, if not with ‘dangerous climate change’. In the minds of people ‘cold’ should be more stable. But, paleo data show that it is‘cold’ that is unstable. While ‘warm’ always shows a high stability in climatic conditions.
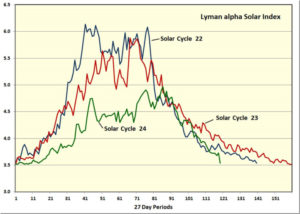
The purpose of this study is to present robust evidence that the sun is working with water vapour to control the Earth’s climate and to show that the influence of CO2 on atmospheric temperature is so small as to be negligible.
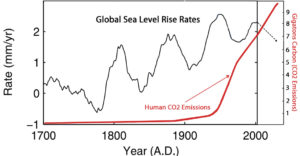
The chart below is taken directly from figures provided by the U.S. government’s Carbon Dioxide Information Analysis Center (CDIAC) website, specifically its 2016 Global Carbon Project spreadsheet on the Historical Budget tab. In terms of gigatons of carbon, and from 1770 to 2004, it itemizes the growth rate of radiative forcing by atmospheric CO2 and the growth rate of oceanic absorption, what is known as a “carbon sink.”
About half of the CO2 emitted by man gets absorbed by the oceans and so does not stay in the atmosphere. Here there are certain areas of the ocean that are especially efficient CO2 sinks, while others do not absorb so well. What follows is a look of the newest literature on the subject.
Each country is committed “to prepare and maintain successive individual nationally determined contributions (INDCs) that it intends to achieve”, to update these plans every five years and to pursue and report on the related domestic emission reduction measures. After three years, a Party may withdraw from the Agreement with one year’s notice.
There is an unresolved debate as to whether to call COP21 an agreement or a treaty.
The Tethys Sea couldn’t have been a better place for petroleum source rock deposition even if it had been designed for such a purpose. The “Tethyan realm” encompassed much of the Jurassic and Cretaceous periods…
This paper has been added to a growing volume of peer-reviewed scientific papers that seriously question estimates of a high climate sensitivity to significant increases in CO2 concentrations.
The discovery by researchers from Imperial could lead to a range of improvements including advances in Carbon Capture and Storage (CCS). This is where industrial emissions will be captured by CCS technology, before reaching the atmosphere, and safely stored in rock deep underground.
The conclusive findings of this research are that the three GAST data sets are not a valid representation of reality. In fact, the magnitude of their historical data adjustments, that removed their cyclical temperature patterns, are totally inconsistent with published and credible U.S. and other temperature data. Thus, it is impossible to conclude from the three published GAST data sets that recent years have been the warmest ever –despite current claims of record setting warming.
When considering the scale of temperature changes that alarmists anticipate because of Man-made Global Warming and their view of the disastrous effects of additional Man-made Carbon Dioxide emissions in this century, it is useful to look at climate change from a longer term, century by century and even on a millennial perspective.
This recent post was on the fact that the Sun’s EUV emissions had fallen to solar minimum-like levels well ahead of solar minimum. The implication was that the Solar Cycle 24/25 minimum was either going to be very deep and prolonged, or that Solar Cycle 24 would be very short, which in turn would be strange for a weak cycle.
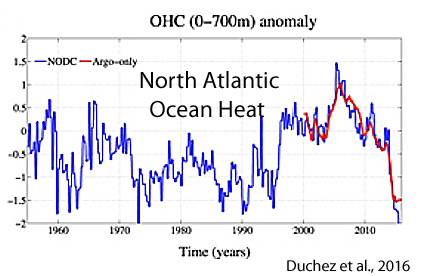
It’s official. According to a new paper published in the journal Scientific Reports,Greenland has been cooling slightly since 2005.
This trend development may be a harbinger of what may be in store for the coming years. Shifts in North Atlantic temperatures typically lead changes in the Arctic by a few years. And throughout the North Atlantic, rapid cooling has been underway since 2005, plunging below the levels reached in the 1950s
The IPCC carbon budget concludes that changes in atmospheric CO2 are driven by fossil fuel emissions on a year by year basis. A testable implication of the validity of this carbon budget is that changes in atmospheric CO2 should be correlated with fossil fuel emissions at an annual time scale net of long term trends. A test of this relationship with insitu CO2 data from Mauna Loa 1958-2016 and flask CO2 data from twenty three stations around the world 1967-2015 is presented. The test fails to show that annual changes in atmospheric CO2 levels can be attributed to annual emissions.
The CO2 safe limit for US Navy submarines is 8,000 ppm (Dotted red line)
The CO2 safe limit for the space station is 5,000 ppm (Dotted blue line)
A line depicting the gradual doubling of CO2 is near the bottom of the graph
The minimum atmospheric CO2 requirements to sustain plant growth is 150 ppm (Dotted green line)
In addition, atmospheric CO2 has been as high as 7,000 ppm approximately 550 million years ago, and as high as 2,000 ppm as recently as 150 million years ago. (Also here in French)
What the graph clearly shows is how close mankind came to extinction when atmospheric CO2 levels dropped to 183 ppm during the last ice age.
Carbon dioxide truly is “the gas of life.” The plants that feed us and wildlife can’t live without inhaling CO2, and then they exhale the oxygen that lets humans and animals keep breathing.
Our crop plants evolved about 400 million years ago, when CO2 in the atmosphere was about 5000 parts per million! Our evergreen trees and shrubs evolved about 360 million years ago, with CO2 levels at about 4,000 ppm. When our deciduous trees evolved about 160 million years ago, the CO2 level was about 2,200 ppm – still five times the current level.
Statistician Bjorn Lomborg had already pointed out that the Paris CO2 emission promises would cost $100 trillion dollars that no one has, and make only a 0.05-degree difference in Earth’s 2100 AD temperature. Others say perhaps a 0.2 degree C (0.3 degrees F) difference, and even that would hold only in the highly unlikely event that all parties actually kept their voluntary pledges.
Despite the lack of growth – even slight decline – in human emissions rates during 2014 – 2016, the atmospheric CO2 parts per million (ppm) concentration grew rapidly – by more than 8 ppm (397 ppm to 405 ppm).
One of the many conundrums facing climate alarmists — who predict that dangerous future global warming will result from increasing concentrations of atmospheric CO2 — is the existence of the aptly-named “warming hiatus.” Also referred to as the “warming pause,” this phenomenon describes a nearly two-decade-long leveling off of global temperatures despite a ten percent increase in atmospheric CO2 concentration since 1998. The significance of these observations resides in the fact that all climate models project that temperatures should not be levelling off, but should be increasing (despite interannual variability) in direct consequence of the ongoing rise in atmospheric CO2.
Until cloud and precipitation data are adequate AND accounted for properly AND the error bands are low enough to cover 1/10 degree increments, we can’t say there is ANY effect from CO2 on temperature. It is at most a conjecture, and not a very good one. You can not ignore the major driver of changes of temperatures (as shown in the above graph) and then attribute temperature changes to something else by supposition.
La géologie, une science plus que passionnante … et diverse
