Archives par mot-clé : Cycle(s)

Geologically Generated Ice Cycles And Climate-Related Phenomena

by J.E. Kamis, Feb 28, 2024 in ClimateChangeDispatch


The term “Ice Age” implies that covering Earth’s surface with ice and then melting it is a single event.

As explained below, this process is not a single event but rather a reoccurring cycle that has three distinct phases: Ice Melt/End Phase, Ice Increase/Recovery Phase, and Normal Ice Extent/Stable Phase.

Ice Melt/End Phase

Approximately every 100,000 years, the Earth’s glaciers and seas reach their maximum extent. Suddenly and within 5,000 years nearly all the ice melts. I term this the Ice Melt Phase.

So, what causes this rapid melting of the ice? It is a geologically induced pulse of heat and gas emitted from all of Earth’s geological features. A more detailed explanation of the Ice Melt Phase follows.

In 1941 Serbian mathematician Milutin Milankovitch discovered that every 100,000 years, the Earth’s orbit around the sun, tilt angle of its axis, and wobble-type movement around the axis changes. Scientists called this process a Milankovitch Cycle.

Milankovitch concluded that these astronomical changes affected Earth’s long-term climate. Others have shown that these astronomical changes also act to greatly increase the gravitational stress on Earth.

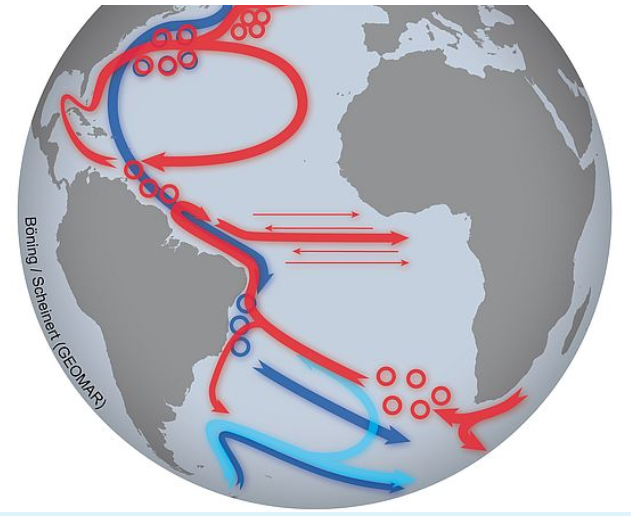
Figure 1. 50,000-mile-long interconnected network of ocean floor fault zones and ice extent during an Ice Cycle. (Image credit Wikipedia, some labeling by J. Kamis).

In my opinion, this stress activates all of Earth’s geological features, most importantly the 50,000-mile-long interconnected network of deep ocean-floor fault zones (Figure 1). These fault zones form the boundary between continents and large segments of ocean-floor rock layers.

Terrestrial temperature, sea levels and ice area links with solar activity and solar orbital motion

by V. Zharkova & I. Vasilieeva, Nov 2023


Abstract: This paper explores the links between terrestrial temperature, sea levels and ice areas in both hemispheres with solar activity indices expressed through averaged sunspot numbers together with the summary curve of eigen vectors of the solar background magnetic field (SBMF) and with changes of Sun-Earth distances caused by solar inertial motion resulting from the gravitation of large planets in the solar system.

Using the wavelet analysis of the GLB  and HadCRUTS datasets two periods: 21.4  and 36 years in GLB, set   and the period of about 19.6 years  in the HadCRUTS are discovered. The 21.4 year period is associated with variations in solar activity defined by the summary curve of the largest eigen vectors of the SBMF. A dominant 21.4-year period is also reported in the variations of the sea level, which is linked with the period of 21.4 years detected in the GLB temperature and the summary curve of the SBMF variations.  The wavelet analysis  of ice and snow areas shows that  in the Southern hemisphere it does not show any links to solar activity periods while in the Northern hemisphere the ice area  reveals  a period of 10.7 years equal to a usual solar acitviity cycle.

The TSI in March-August of every year  is found  to grow with every year following closely the temperature curve, because the Sun moves  closer to the Earth orbit owing to gravitation of large planets. (solar inertial motion, SIM). While the variations of solar radiation during a whole year have  more steady distribution without  a sharp TSI increase  during the last two centuries. The additional TSI contribution caused by SIM is likely to secure the additional energy input and exchange between the ocean and atmosphere.


Link to pre-print:  https://solargsm.com/wp-content/uploads/2023/11/zharkova_tsi_nc_form_subm-1.pdf


The paper is accepted for publication.

Elegantly modeling Earth’s abrupt glacial transitions

by American Institute of Physics, Mar 7, 2023 in ScienceDaily


Proxy data — indirect records of the Earth’s climate found in unlikely places like coral, pollen, trees, and sediments — show interesting oscillations approximately every 100,000 years starting about 1 million years ago. Strong changes in global ice volume, sea level, carbon dioxide concentration, and surface temperature indicate cycles of a long, slow transition to a glacial period and an abrupt switch to a warm and short interglacial period.

Milutin Milankovitch hypothesized that the timing of these cycles was controlled by the orbital parameters of the Earth, including the shape of its path around the sun and the tilt of the planet. A slightly closer orbit or more tilted planet could create a small increase in solar radiation and a feedback loop that leads to massive changes in climate. This idea suggests that there may be some predictability in the climate, a notoriously complex system.

In Chaos, by AIP Publishing, Stefano Pierini of Parthenope University of Naples proposed a new paradigm to simplify the verification of the Milankovitch hypothesis.

“The main motivation behind this study was the wish to characterize and illustrate the Milankovitch hypothesis in a simple, elegant, and intuitive way,” Pierini said.

Many models suggest that Milankovitch is correct; however, such methods are often detailed and study specific. They incorporate climate feedback loops — for example, increased ice cover reflects more radiation back into space, leading to further cooling and more ice cover — as threshold crossing rules. This means that an abrupt jump in climate only occurs once a parameter reaches a given tipping point.

Pierini’s “deterministic excitation paradigm” combines the physics concepts of relaxation oscillation and excitability to link Earth’s orbital parameters and the glacial cycles in a more generic way. The relaxation oscillation component describes how the climate slowly returns to its original glacier state after it is disturbed. At that point, the excitability piece of the model captures the external orbital changes and triggers the next glacial cycle.

By using his own threshold crossing rules and adopting a classical energy-balance model, Pierini obtained correct and robust timing of the most recent glacial cycles.`

NEW STUDY: “Part Of North Atlantic Is Cooling”…”Natural Fluctuations Have Been Primary Reason”

by P. Gosselin, Apr 30, 2022 in NoTricksZone


New studies on the Atlantic current system assess the threshold between natural fluctuations and a climate change-driven evolution

25 April, 2022/Kiel, Germany. With a new publication in the scientific journal Nature Climate Change, researchers from Kiel once again contribute to the understanding of changes in the Atlantic Meridional Overturning Circulation (AMOC) – also known as the “Gulf Stream System”. It is important both for the global climate as well as for climate events in Europe. The authors focus on the question whether human-induced climate change is already slowing down this oceanic circulation. According to the new study, natural variations are still dominant. Improved observation systems could help detect human influences on the current system at an early stage.

Is the Atlantic Meridional Overturning Circulation (AMOC) slowing down? Is this system of ocean currents, which is so important for our climate, likely to come to a halt in the future? Are the observed variations a natural phenomenon or are they already caused by human-induced climate change? Researchers from various scientific disciplines use a wide range of methods to better understand the gigantic oceanic circulation.

“The AMOC provides Europe with a mild climate and determines seasonal rainfall patterns in many countries around the Atlantic. If it weakens over the long term, this will also affect our weather and climate. Other consequences could be a faster rise in sea levels at some coasts or a reduction in the ocean’s ability to take up carbon dioxide and mitigate climate change”, Professor Dr. Mojib Latif, Head of the Research Unit: Marine Meteorology at GEOMAR Helmholtz Centre for Ocean Research Kiel, explains. “We depend on the AMOC in many ways – but so far, we can only guess how it will develop, and whether and how strongly we humans ourselves will push it towards a tipping point where an unstoppable collapse will take its course.”

Using observational data, statistical analyses and model calculations, a team led by Professor Latif has therefore examined changes in the current system over the past one hundred years in greater detail. The results have now been published in the scientific journal Nature Climate Change. According to the researchers, part of the North Atlantic is cooling – a striking contrast to the majority of ocean regions. All evaluations indicate that since the beginning of the 20th century, natural fluctuations have been the primary reason for this cooling. Nonetheless, the studies indicate that the AMOC has started to slow down in recent decades.

The inter-glacial cycle is not a 100,000-year cycle, it is a shorter cycle with missing beats

by M.O. Jonas, 2022, WorldJ.Adv.ResReviews


Review Article
World Journal of Advanced Research and Reviews, 2022, 13(03), 388–392
Article DOI: 10.30574/wjarr.2022.13.3.0259
Publication history:
Received on 18 February 2022; revised on 20 March 2022; accepted on 22 March 2022
Abstract:
The “100,000-year problem” refers to an apparent unexplained change in the frequency of inter-glacial periods which occurred about a million years ago. Before that, inter-glacial periods seemed to occur about every 41,000 years, in line with the obliquity Milankovich cycle. But after that, they seemed to occur about every 100,000 years, in line with the orbital inclination Milankovich cycle. Examination of the data shows that there never was a 41,000-year cycle, and that there is no 100,000-year cycle, but that the most influential cycle is the approx 21,000-year precession cycle which is the major factor in the cycles of insolation at higher latitudes. Insolation at 65N is generally regarded as the most significant of these. Inspection of the data shows that every glacial termination (start of an inter-glacial period) began at a time when insolation at 65N increased from a low point in its cycle. That not every such cycle triggered a new inter-glacial period underlines the chaotic non-linear nature of Earth’s climate. Until about a million years ago, this cycle occasionally “missed a beat”, making the inter-glacial frequency average about 41,000 years. After that, the cycle started missing more “beats”, making the inter-glacial frequency average about 100,000 years. There never was an actual 41,000-year or 100,000-year inter-glacial cycle.
Keywords:
Climate; Glacial Termination; Inter-Glacial; Milankovich Cycle; Non-Linear; Precession
Full text article in PDF:

Two Dozen Top Scientists: IPCC “Premature” Blaming CO2 Emissions…Warming Mostly From Natural Cycles

by P. Gosselin, Aug 18, 2021 in NoTricksZone


Most of the energy in the Earth’s atmosphere comes from the Sun. This new study found that the UN’s Intergovernmental Panel on Climate Change (IPCC) only considered a small subset of the published TSI datasets when they assessed the role of the Sun in climate change and that this subset only included “low solar variability” datasets. As a result, the IPCC was premature in ruling out a substantial role for the Sun in recent climate change.

A diverse expert panel of global scientists finds blaming climate change mostly on greenhouse gas emissions was premature. Their findings contradict the UN IPCC’s conclusion, which the study shows, is grounded in narrow and incomplete data about the Sun’s total solar irradiance.

The paper by 23 experts in the fields of solar physics and of climate science from 14 different countries is published in the peer-reviewed journal  (RAA). The paper, which is the most comprehensive to date, carries out an analysis of the 16 most prominent published solar output datasets, including those used by the IPCC.

Scientists come to opposite conclusions recent climate change causes 

The researchers compared them to 26 different estimates of Northern Hemisphere temperature trends since the 19th century (sorted into five categories), including the datasets used by the IPCC. They focused on the Northern Hemisphere since the available data for the early 20th century and earlier is much more limited for the Southern Hemisphere, but their results can be generalized for global temperatures.

CARBON CYCLE

by C. Spencer, June 7, 2021 in WUWT


The increase in 12C in the atmosphere is, in my opinion, weak evidence that the annual increases are driven only by fossil fuel sources. The atmosphere can’t tell ‘anthropogenic’ carbon dioxide from natural carbon dioxide. It seems unlikely that a source that represents only about 4% of the total flux is going to drive the system. The oceans sequester the vast majority of the carbon. One would expect that warming oceans (from whatever forcing) would increase the rate of out-gassing in mid-latitudes, and decrease the rate of extraction at high-latitudes. It seems more reasonable to me that, in a world with warming oceans, there would be a shift in the relative amounts of carbon in the oceans and the atmosphere. That would be the case even in the absence of any anthropogenic carbon.


….

….

The Sun’s climate role confirmed

by D. Whitehouse, April 6, 2021 in GWPF


“The scientific community has been unclear on the role that solar variability plays in influencing weather and climate events here on Earth. This study shows there’s reason to believe it absolutely does and why the connection may have been missed in the past.”

Top: Six-month smoothed monthly sunspot number from SILSO.  Bottom: Oceanic El Niño Index from NOAA. Red and blue boxes mark the El Niño and La Niña periods in the repeating pattern. Source: Climate Etc, September 2019

If you ask most climate scientists, they will tell you that the Sun’s small variability is unimportant when it comes to influencing climate. They may have to change their minds if a new line of research holds up. It seems that solar variability can drive climate variability on Earth on decadal timescales (the decadal climatic variability that Michael Mann recently ‘proved’ doesn’t exist). That’s the conclusion of a new study showing a correlation between the end of solar cycles and a switch from El Nino to La Nina conditions in the Pacific Ocean. It’s a result that could significantly improve the predictability of the largest El Nino and La Nina events, which have several global climate effects.

New study ties solar variability to the onset of decadal La Nina events

by C. Rotter, April 5, 2021 in NATIONAL CENTER FOR ATMOSPHERIC RESEARCH/UNIVERSITY CORPORATION FOR ATMOSPHERIC RESEARCH


A new study shows a correlation between the end of solar cycles and a switch from El Nino to La Nina conditions in the Pacific Ocean, suggesting that solar variability can drive seasonal weather variability on Earth.

If the connection outlined in the journal Earth and Space Science holds up, it could significantly improve the predictability of the largest El Nino and La Nina events, which have a number of seasonal climate effects over land. For example, the southern United States tends to be warmer and drier during a La Nina, while the northern U.S. tends to be colder and wetter.

“Energy from the Sun is the major driver of our entire Earth system and makes life on Earth possible,” said Scott McIntosh, a scientist at the National Center for Atmospheric Research (NCAR) and co-author of the paper. “Even so, the scientific community has been unclear on the role that solar variability plays in influencing weather and climate events here on Earth. This study shows there’s reason to believe it absolutely does and why the connection may have been missed in the past.”

The study was led by Robert Leamon at the University of Maryland-Baltimore County, and it is also co-authored by Daniel Marsh at NCAR. The research was funded by the National Science Foundation, which is NCAR’s sponsor, and the NASA Living With a Star program.

Applying a new solar clock

Apparent Atlantic warming cycle likely an artifact of climate forcing

by A.E. Messer & S. Lajeunesse, March 25, 2021 inPennStateNews


This map of the Earth shows the spacial pattern of temperature variance by percentage. The most variance is seen in the tropics with less at the poles. IMAGE: DANIEL J. BROUILLETTE. PENN STATE

UNIVERSITY PARK, Pa. — Volcanic eruptions, not natural variability, were the cause of an apparent “Atlantic Multidecadal Oscillation,” a purported cycle of warming thought to have occurred on a timescale of 40 to 60 years during the pre-industrial era, according to a team of climate scientists who looked at a large array of climate modeling experiments.

The result complements the team’s previous finding that what had looked like an “AMO” occurring during the period since industrialization is instead the result of a competition between steady human-caused warming from greenhouse gases and cooling from more time-variable industrial sulphur pollution.

“It is somewhat ironic, I suppose,” said Michael E. Mann, distinguished professor of atmospheric science and director, Earth System Science Center, Penn State. “Two decades ago, we brought the AMO into the conversation, arguing that there was a long-term natural, internal climate oscillation centered in the North Atlantic based on the limited observations and simulations that were available then, and coining the term ‘AMO.’ Many other scientists ran with the concept, but now we’ve come full circle. My co-authors and I have shown that the AMO is very likely an artifact of climate change driven by human forcing in the modern era and natural forcing in pre-industrial times.”

The researchers previously showed that the apparent AMO cycle in the modern era was an artifact of industrialization-driven climate change, specifically the competition between warming over the past century from carbon pollution and an offsetting cooling factor, industrial sulphur pollution, that was strongest from the 1950s through the passage of the Clean Air Acts in the 1970s and 1980s. But they then asked, why do we still see it in pre-industrial records?

Japanese Climate Scientist Kyoji Kimoto: “Climate Change Governed By The Sun”, CO2 Lesser Role!

by P. Gosselin, Jan 22, 2021 in NoTricksZone


I’ve compiled a list of six examples how the sun impacts climate across the globe.

1. Climate periods based on a double Hale (44-45 years) cycle of solar activity.

In 1977 Australian geologist Rhodes W. Fairbridge found a 45-year periodicity of beach ridge located at the Hudson Bay. It has been formed with storms in Hudson Bay caused by a wavier jet stream.

I have found a 44-year periodicity of heavy snowfall in Japan caused by the wavier jet stream as follows. The time series coincide quite well with that of Fairbridge (1977).

1833   Tempo famine, Dalton minimum (1795-1830)
1877   Seinan war (44 years later)
1918   Rice riot, Gleissberg minimum (1898-1923) (41 years later)
1963   38 heavy snowfall (45 years later)
2006  Heisei 18 year heavy snowfall, Gleissberg or Dalton minimum (43 years)

The climate history of 20th century can be divided with the following 5 periods based on the double Hale cycle above using aa-index of geomagnetism associated with solar activity. The Pacific Climate Shift occurred at 1977 with solar activity increase & a positive PDO index.

1900-1918: Little Ice Age (LIA)
1919-1962: 1st Modern Warm Period (1st MWP)
1963-1976: Temporal Cold Period  (TCP, New Ice Age Coming, see below)
1977-2005: 2nd Modern Warm Period (2nd MWP)
2006 – present: New Cold Period (NCP)

Des réchauffements répétitifs sans CO2 ?

by P. Berth & A. Préat, 24 janvier 2020 in ScienceClimatEnergie


Depuis le début des mesures thermométriques directes, les 4 principales séries de température  que nous possédons (thermomètres terrestres et satellites) nous montrent que la température globale de la basse troposphère a augmenté de ± 0,8°C en 138 ans (entre 1880 et 2018). Cela correspond à ± 0,28°C en 50 ans soit 0,006°C/an(actuellement environ 0,01°C/an pour les 30 dernières années). Les médias nous rappellent chaque jour que cette hausse est exceptionnelle et que le CO2 anthropique en est à l’origine, c’est-à-dire est le grand coupable suivant la terminologie consacrée.

Mais cette vitesse d’augmentation de la température, est-elle vraiment exceptionnelle? Dans les lignes qui suivent, nous allons vous démontrer qu’il n’en est rien. Au cours de la dernière période glaciaire, alors que l’espèce humaine existait déjà, la température moyenne a parfois augmenté à une vitesse vingt fois plus élevée, et ce à de nombreuses reprises. Ces phénomènes particuliers, qui n’ont pas fait disparaître la vie sur Terre, et que nous vous avions déjà mentionnés sur SCE (ici), sont appelés évènements de Dansgaard-Oeschger ou ‘DO’ (des noms des deux scientifiques -danois et suisse-  qui furent les premiers à les mettre en évidence) et sont reconnus par le GIEC. Comme nous allons vous le montrer dans le présent article, le taux de CO2 n’aurait qu’un rôle mineur dans ces évènements.

Figure 1. Stratigraphie isotopique de l’oxygène à partir des glaces du forage GRIP (Groenland).
En ordonnée valeurs du δ
18O en ‰ et en abscisse profondeur en mètres du forage (Cronin, 2010). Les compositions isotopiques de l’oxygène sont un indicateur de la température. La figure montre de manière très claire que l’interglaciaire actuel (Holocène, moitié gauche du graphique) est caractérisé par des fluctuations thermiques de faible amplitude (si l’on excepté un épisode plus froid vers 8,2 ka) alors que le Dernier Glaciaire (moitié droite du graphique) montre des changements climatiques fréquents, rapides et de grandes amplitudes (de 8°C à 16°C suivant les δ18O) enregistrés pas les événements ou ‘cycles’ DO (Dansgaard-Oeschger events). Nb: YD pour Younger Dryas, correspondant à un refroidissement il y a 12800 ans BP (non discuté dans cet article).


Ancient Air Challenges Prominent Explanation For A Shift In Glacial Cycles

by E. W. Wolf, November 4, 2019 in WUWT


From Nature

An analysis of air up to 2 million years old, trapped in Antarctic ice, shows that a major shift in the periodicity of glacial cycles was probably not caused by a long-term decline in atmospheric levels of carbon dioxide.

Eric W. Wolff

During the past 2.6 million years, Earth’s climate has alternated between warm periods known as interglacials, when conditions were similar to those of today, and cold glacials, when ice sheets spread across North America and northern Europe. Before about 1 million years ago, the warm periods recurred every 40,000 years, but after that, the return period lengthened to an average of about 100,000 years. It has often been suggested that a decline in the atmospheric concentration of carbon dioxide was responsible for this fundamental change. Writing in Nature, Yan et al.1 report the first direct measurements of atmospheric CO2 concentrations from more than 1 million years ago. Their data show that, although CO2levels during glacials stayed well above the lows that occurred during the deep glacials of the past 800,000 years, the maximum CO2 concentrations during interglacials did not decline. The explanation for the change must therefore lie elsewhere.

Understanding what caused the shift in periodicity, known as the mid-Pleistocene transition (MPT), is one of the great challenges of palaeoclimate science. The 40,000-year periodicity that dominated until about 1 million years ago is easily explained, because the tilt of Earth’s spin axis relative to its orbit around the Sun varies between 22.1° and 24.5° with the same period. In other words, before the MPT, low tilts led to cooler summers that promoted the growth and preservation of ice sheets.

But after the MPT, glacial cycles lasted for two to three tilt cycles. Because the pattern of variation in Earth’s orbit and tilt remained unchanged, this implies that the energy needed to lose ice sheets2 had increased. One prominent explanation3 is that atmospheric levels of CO2 were declining, and eventually crossed a threshold value below which the net cooling effect of the decline allowed ice sheets to persist and grow larger.

Oscillations of the baseline of solar magnetic field and solar irradiance on a millennial timescale

by Zharkova et al., June 24, 2019 in ScientificReportsNature


Abstract

Recently discovered long-term oscillations of the solar background magnetic field associated with double dynamo waves generated in inner and outer layers of the Sun indicate that the solar activity is heading in the next three decades (2019–2055) to a Modern grand minimum similar to Maunder one. On the other hand, a reconstruction of solar total irradiance suggests that since the Maunder minimum there is an increase in the cycle-averaged total solar irradiance (TSI) by a value of about 1–1.5 Wm−2 closely correlated with an increase of the baseline (average) terrestrial temperature. In order to understand these two opposite trends, we calculated the double dynamo summary curve of magnetic field variations backward one hundred thousand years allowing us to confirm strong oscillations of solar activity in regular (11 year) and recently reported grand (350–400 year) solar cycles caused by actions of the double solar dynamo. In addition, oscillations of the baseline (zero-line) of magnetic field with a period of 1950 ± 95 years (a super-grand cycle) are discovered by applying a running averaging filter to suppress large-scale oscillations of 11 year cycles. Latest minimum of the baseline oscillations is found to coincide with the grand solar minimum (the Maunder minimum) occurred before the current super-grand cycle start. Since then the baseline magnitude became slowly increasing towards its maximum at 2600 to be followed by its decrease and minimum at ~3700. These oscillations of the baseline solar magnetic field are found associated with a long-term solar inertial motion about the barycenter of the solar system and closely linked to an increase of solar irradiance and terrestrial temperature in the past two centuries. This trend is anticipated to continue in the next six centuries that can lead to a further natural increase of the terrestrial temperature by more than 2.5 °C by 2600.

Sun spotless for 33 days straight – airline travelers getting dosed with up to 70 times more radiation

by A. Watts, June 21, 2019 in WUWT


Are we in a solar grand minimum? We’ve seen this before, but now predictions are for an extremely weak solar cycle ahead.

Today is the summer solstice in the northern hemisphere. The sun has been without a single observable sunspot now for over a month – 33 days according to NOAA and SIDC data.


Daily observations of the number of sunspots since 1 January 1977 according to Solar Influences Data Analysis Center (SIDC). The thin blue line indicates the daily sunspot number, while the dark blue line indicates the running annual average. The recent low sunspot activity is clearly reflected in the recent low values for the total solar irradiance. Compare also with the geomagnetic Ap-index. Data source: WDC-SILSO, Royal Observatory of Belgium, Brussels. Last day shown: 31 May 2019. Last diagram update: 1 June 2019 . [Courtesy climate4you.com]

..

Cycles of Rapid Climate Warming

by Jim Steele, May 28, 2018 in WUWT


The globally averaged temperature rose 1.5°F from 1880 to today. Various narratives suggest the rise since 1950 was driven by increasing concentrations of CO2. The rising temperature before 1950 was considered natural. Since 1990, Arctic temperatures rose 2 to 3 times faster than the global average. So, are rapidly rising Arctic temperatures evidence of an impending climate crisis?

Astute students of climate history recall rapid Arctic warming has happened often and naturally. During the last Ice Age when CO2 concentrations were just half of today’s, 25 abrupt warming events happened. Arctic temperatures rose 9°F, and sometimes as much as 14°F in just 40 years. These rapid warming episodes are now called Dansgaard–Oeschger events (D-O events) in honor of the researchers who first detected them in Greenland’s ice cores. These D-O episodes affected global climate, changed ocean currents along California’s coast and altered the range of European forests.

What caused such abrupt warming? Basic physics dismisses changes in greenhouse gases or solar insolation because neither radiative effect induces such rapid warming. The most reasonable explanation suggests episodes of ventilating heat, that had accumulated in the Arctic Ocean, rapidly warmed the air.

Global-scale multidecadal variability missing in state-of-the-art climate models

by S. Kravstov et al. 2018, in Nature


Reliability of future global warming projections depends on how well climate models reproduce the observed climate change over the twentieth century. In this regard, deviations of the model-simulated climate change from observations, such as a recent “pause” in global warming, have received considerable attention. Such decadal mismatches between model-simulated and observed climate trends are common throughout the twentieth century, and their causes are still poorly understood. Here we show that the discrepancies between the observed and simulated climate variability on decadal and longer timescale have a coherent structure suggestive of a pronounced Global Multidecadal Oscillation. Surface temperature anomalies associated with this variability originate in the North Atlantic and spread out to the Pacific and Southern oceans and Antarctica, with Arctic following suit in about 25–35 years. While climate models exhibit various levels of decadal climate variability and some regional similarities to observations, none of the model simulations considered match the observed signal in terms of its magnitude, spatial patterns and their sequential time development. These results highlight a substantial degree of uncertainty in our interpretation of the observed climate change using current generation of climate models.

Modern Climate Wavelet Patterns

by Renee Hannon, December 17, 2018 in WUWT


Wavelet analyses of modern global temperature anomalies provides an excellent visualization tool of temperature signal characteristics and patterns over the past 150 years. Scafetta recognized key temperature oscillations of about 9, 20 and 60-years using power spectra of global surface temperature anomalies. There has been much discussion about the 60-year quasi-oscillation both in WUWT and publications.

Detrending the temperature time series and removing the 60-year underlying trend enables insights into the interplay of interannual and decadal scales. Wavelet analyses reveals these periodic signals have distinguished patterns and characteristics that repeat over time suggesting natural external and internal influences. Interannual wavelet patterns that consist of 9-year and 3 to 5-year quasi-oscillations are repeated and dominate over 70% of the instrumental record. The 3 to 5-year discontinuous breakouts are coincident to El Niño and La Niña events of the El Niño-Southern Oscillation (ENSO). A period of quiescence from 1925 to 1960 is devoid of most wavelet signals suggesting different or transitional climate processes.

Cycle du carbone, l’éclairage de trois nouvelles publications

by Uzbek, 11 septembre 2018 in Climat,Environnemen,Energie


Trois nouvelle études publiées en août 2018 apportent un éclairage nouveau sur le cycle du carbone. La première, publiée dans la revue Nature [1] montre que le taux de croissance du CO2  dans l’atmosphère est très sensible aux changements observés dans le stockage de l’eau terrestre. Les deux autres publiées respectivement dans Nature Geoscience [2] et dans Nature [3] montrent une tendance à l’augmentation du puits de carbone terrestre grâce notamment  aux modifications de l’usage des sols sous l’influence des activités humaines.

Statistical study of past temperature records suggest possible undetected natural climate forcing cycles

by Anthony Watts, September 18, 2018 in WUWT


Godfrey Dack writes in with this:

Everyone will be familiar with the difficulty of listening to a conversation held with a friend in a crowded room with many other conversations going on at the same time. So it is with many fields of scientific investigation where it is difficult to tease a particular trend out from masses of data. In the first case, we could call the friend’s conversation ‘The Signal’, and the background conversations ‘The Noise’.

In looking at climate data, trends (the signal) can be graphically represented by a (generally) smooth curve, usually flanked by a range of experimentally predicted or actually measured values (the noise). Joining up every point on a graph of such data would give a jagged line which could be thought of as a combination of many alternating functions over a wide range of frequencies.

Beyond Milankovitch

by Donald Rapp, September 8, 218 in Climate Etc.


On the terminations of Ice Ages.

Terminations occur on solar up-lobes

There is no doubt that there is merit in the widely accepted Milankovitch theory that Ice Ages and their terminations are controlled by solar input to the NH in mid-summer. It is also clear that relying on the solar input to the NH alone, does not adequately account for the occurrence of terminations of Ice Ages. The variation of solar input to high latitudes is modulated by precession, which produces continual up-lobes and down-lobes in solar input with a ~ 22,000-year period. While every termination is accompanied by the 5,500-year rising portion of an up-lobe in the solar input to high latitudes, many strong up-lobes do not produce a termination….

Harmonic Analysis of Worldwide Temperature Proxies for 2000 Years

by H.J. Lüdecke and C.O. Weiss, April 27, 2017 in TheOpenAtm.Sci.J.


Abstract

The Sun as climate driver is repeatedly discussed in the literature but proofs are often weak. In order to elucidate the solar influence, we have used a large number of temperature proxies worldwide to construct a global temperature mean G7 over the last 2000 years. The Fourier spectrum of G7 shows the strongest components as ~1000-, ~460-, and ~190 – year periods whereas other cycles of the individual proxies are considerably weaker. The G7 temperature extrema coincide with the Roman, medieval, and present optima as well as the well-known minimum of AD 1450 during the Little Ice Age. We have constructed by reverse Fourier transform a representation of G7 using only these three sine functions, which shows a remarkable Pearson correlation of 0.84 with the 31-year running average of G7. The three cycles are also found dominant in the production rates of the solar-induced cosmogenic nuclides 14C and 10Be, most strongly in the ~190 – year period being known as the De Vries/Suess cycle. By wavelet analysis, a new proof has been provided that at least the ~190-year climate cycle has a solar origin.

Modulation of Ice Ages via Precession and Dust-Albedo Feedbacks

by Ralph Ellis, August 2018 in FriendsofScience


Why do ice ages occur? Surprisingly, even after many decades of paleoclimatic research we simply do not know for sure. Most scientists will agree that ice age cycles have something to do with precession: the slow wobble of the axis of the Earth. The ancient Egyptians and Greeks knew of precession and called it the Great Year, because it gives warm and cool seasons over its approximate 23,000-year cycle. But there is a problem with invoking the Great Year as the regulator of ice ages, because we should really get an interglacial warming every 23,000 years or so. And we don’t – they only happen every fourth or fifth Great Year.

But why should the global climate give a selective response to orbital warming and cooling? (Called ‘forcing’ in the climate trade.) This is one of the great unknowns of modern science.

Lightning strikes occur in time with the spinning Sun in 150 year old Japanese farm records

by Jo Nova, July 19, 2018 in JoNova


Remarkably, some Japanese families kept weather record diaries in the 1700 and 1800s, and some for as long as 150 years. The connections they reveal are tantalizing but so incomplete. We are trying to fish out primitive signals from murky water. The Sun turns around on itself every 27 days, so these researchers are looking for repeating patterns in lightning that fit, but the poles of the sun spin slower than the equator and the sun spots can take their own time. Hence, it’s not a neat “27″ days.

During periods of high solar activity, they found regular peaks in lightning activity with the right timing, from May to September when the cold Siberian air mass is not so influential.

Other studies we’ve discussed here have investigated long solar cycles on the 11 year or 200 year scales ….