Archives par mot-clé : CO2

Past global photosynthesis reacted quickly to more carbon in the air

by University of Copenhagen, Mar 10, 2022 in ScienceDaily


Ice cores allow climate researchers to look 800,000 years back in time: atmospheric carbon acts as fertilizer, increasing biological production. The mechanism removes carbon from the air and thereby dampens the acceleration in global warming.

Even under ice age conditions will plants, plankton, and other life forms be able to increase production whenever atmospheric carbon concentrations rise. The mechanism will not prevent an ongoing trend of global warming, but at least dampen the acceleration. This conclusion stems from an international collaboration involving the Physics of Ice Climate Earth (PICE) center of Niels Bohr Institute, University of Copenhagen.

“Global biosphere production through photosynthesis is the strongest absorbing flux of atmospheric carbon dioxide. It is therefore essential to understand its natural variability for a better projection of the future carbon cycle,” says Postdoc researcher Ji-Woong Yang, PICE, continuing:

“Nowadays, as we have Earth observation satellites and other advanced equipment, the mechanism of carbon fertilization is well established. However, we were not sure that the same mechanism existed in past periods where the climate was very different and atmospheric carbon concentrations much lower. The new results confirm the existence of the strong correlation and allow us to model future developments with more confidence.”

Eight glacial cycles are covered

In collaboration with Laboratoire des Science du Climat et de l’Environnement, France, the PICE team has studied the ancient air trapped inside tiny air bubbles in an Antarctic ice core. The ice core represents the last 800,000 years of climatic development.

The scientists take advantage of the fact that the oxygen atom does not only exist in the most common form 16O with 8 protons and 8 neutrons but also as the isotopes 17O and 18O. The isotopic composition is a tracer for biosphere productivity. Uniquely, the method will show the global level of biological production in contrast to other methods which give more localized results.

Combining the air bubble measurements with modeling of oxygen behavior in both the biosphere and the stratosphere, the researchers were able to quantify the biosphere productivity evolution under both glacial periods (ice ages) and interglacial periods. In total, eight glacial cycles were covered.

“The results clearly demonstrate that productivity drops during glacial periods and increases during interglacial periods. Further, a strong correlation exists with past atmospheric carbon dioxide concentrations measured from multiple ice cores. In addition, the effect is more prominent during glacial periods where the level of carbon dioxide and the global biosphere productivity start to increase several thousand years before the ice caps begin to melt. This correlation is explained by the strong fertilization effect by atmospheric carbon dioxide,” says Ji-Woong Yang.

The IPCC CO2 Climate Narrative: A “Behemoth On Clay Feet” …Ready To Collapse

by P. Gosselin, Fab, 6, 2022 in NoTricksZone


The earth’s history provides the solid proof that acquits CO2. The IPCC’s claim of CO2 being the dominant climate factor is a behemoth on clay feet. 

By Fred F. Mueller

Have you ever had an uneasy feeling when watching the aggressive, intolerant stance of the apologists of “man-made climate catastrophe” against all critics?

The overwhelming majority of our elites blame CO2 emitted by mankind to be responsible for “a runaway overheating” of our atmosphere. “The science” spearheaded by the Intergovernmental Panel on Climate Change (IPCC) calls for us to renounce fossil fuels and return to the frugal lifestyle of the 18th or 19th century.

You might well find you’re not alone with that unease, which is proliferating rapidly since social media giants have started to censor people daring to question the IPCC’s “science is settled” attitude.

Rare earths reveal new info in volcanoes’ CO2 emissions

by Mining.com Staff Writer, Jan 28, 2022, in TheNorthernMinerMaps


In a paper published in the journal Geology, the scientists explain that over geological times, variations in atmospheric CO2 depended mainly on volcanic emissions, which are difficult to estimate because they are not directly related to the volume of the magmas that erupted. Indeed, some volcanoes show exceptionally large emissions of CO2 when compared to the amount that can be dissolved in their magmas. Etna is perhaps the most striking example, contributing to 10% (9000 tons/day) of the present global volcanic CO2 emission. That is three times more CO2 than a volcano like Kilauea in Hawaii emits, which erupts four times more magma.

But ratios of Nb/Ta are very constant in many rocks and are only modified by few geological processes—like the infiltration of carbonate-rich melts in earth’s mantle.

World Atmospheric CO2, Its 14C Specific Activity, Non-fossil Component, Anthropogenic Fossil Component, and Emissions (1750–2018

by Kenneth et al. 2022, Feb 2022 in HealthPhysics


Abstract

After 1750 and the onset of the industrial revolution, the anthropogenic fossil component and the non-fossil component in the total atmospheric CO2 concentration, C(t), began to increase. Despite the lack of knowledge of these two components, claims that all or most of the increase in C(t)since 1800 has been due to the anthropogenic fossil component have continued since they began in 1960 with “Keeling Curve: Increase in CO2from burning fossil fuel.” Data and plots of annual anthropogenic fossil CO2 emissions and concentrations, C(t), published by the Energy Information Administration, are expanded in this paper. Additions include annual mean values in 1750 through 2018 of the 14C specific activity, concentrations of the two components, and their changes from values in 1750. The specific activity of 14C in the atmosphere gets reduced by a dilution effect when fossil CO2, which is devoid of 14C, enters the atmosphere. We have used the results of this effect to quantify the two components. All results covering the period from 1750 through 2018 are listed in a table and plotted in figures. These results negate claims that the increase in C(t) since 1800 has been dominated by the increase of the anthropogenic fossil component. We determined that in 2018, atmospheric anthropogenic fossil CO2 represented 23% of the total emissions since 1750 with the remaining 77% in the exchange reservoirs. Our results show that the percentage of the total CO2 due to the use of fossil fuels from 1750 to 2018 increased from 0% in 1750 to 12% in 2018, much too low to be the cause of global warming.

New Research: “CO2 Influence On Global Temperature Development Since1860 Only Half As Large As IPCC Estimate!

by  F. Vahrenholt, Dec 14, 2021 in NoTricksZone


On November 3, 2021, the renowned scientific journal Climate published a paper on solar influence on climate.

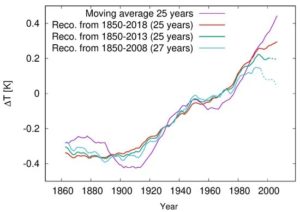
The paper by the renowned solar researcher Dr. Frank Stefani from the Helmholtz Zentrum Dresden-Rossendorf is entitled: “Solar and Anthropogenic Influences on Climate: A Regression Analysis and Tentative Predictions” and concludes that the influence of CO2 on the development of global temperatures from 1860 until today was only about half as large as the last report of the Intergovernmental Panel on Climate Change (IPCC) assumed.

As a reminder, the IPCC concludes that 98% of the warming ( 1.07 degrees out of 1.09 degrees) is human-induced. According to Stefani’s analysis, the solar influence accounts for 30-70%.

Stefani examined the course of the geomagnetic aa – index, which reflects the strength of the earth’s magnetic field. This index has been measured in Cambridge and Melbourne since 1844 and reflects the influence of solar activity. In earlier publications, Stefani had already been able to prove that the 11-year solar cycle is triggered by the gravitational forces of Venus, Earth and Jupiter, which are in orbital resonance every 11.07 years (here, here and here).

Since the Sun – influenced by all the planets (especially Jupiter and Saturn) – also moves around the center of gravity of the solar system, solar cycles arise that have become known in temperature history as the 193-year Suess-de Vries cycle and the 90-year Gleissberg cycle.

Autocorrelation in CO2 and Temperature Time Series

by A. May, Nov 14, 2021 in WUWT


In my last post I plotted the NASA CO2 and the HadCRUT5 records from 1850 to 2020 and compared them. This was in response to a plot posted on twitter by Robert Rohde implying they correlated well. The two records appear to correlate because the resulting R2 is 0.87. The least square’s function used made the global temperature anomaly a function of the logarithm to the base 2 of the CO2 concentration (or ‘log2CO2‘). This means the temperature change was assumed to be linear with the doubling of the CO2concentration, a common assumption. The least squares (or ‘LS’) methodology assumes there is no error in the measurements of the CO2 concentration and all error resulting from the correlation (the residuals) resides in the HadCRUT5 global average surface temperature estimates.

In the comments to the previous post, it became clear that some readers understood the computed R2(often called the coefficient of determination), from LS, was artificially inflated because both X (log2CO2) and Y (HadCRUT5) were autocorrelated and increased with time. But a few did not understand this vital point. As most investors, engineers, and geoscientists know, two time series that are both autocorrelated and increase with time will almost always have an inflated R2. This is one type of “spurious correlation.” In other words, the high R2 does not necessarily mean the variables are related to one another. Autocorrelation is a big deal in time series analysis and in climate science, but too frequently ignored. To judge any correlation between CO2 and HadCRUT5 we must look for autocorrelation effects. The most tool used is the Durbin-Watson statistic.

The Durbin-Watson statistic tests the null hypothesis that the residuals from a LS regression are not autocorrelated against the alternative that they are. The statistic is a number between 0 and 4, a value of 2 indicates non-autocorrelation and a value < 2 suggests positive autocorrelation and a value >2 suggests negative autocorrelation. Since the computation of R2 assumes that each observation is independent of the others, we hope that we get a value of 2, that way the R2 is valid. If the regression residuals are autocorrelated and not random—that is normally distributed about the mean—the R2 is invalid and too high. In the statistical program R, this is done—using a linear fit—with only one statement, as shown below:

CO2 and Temperature

by A. May, Nov 9, 2021 in WUWT


I had a very interesting online discussion about CO2 and temperature with Tinus Pulles, a retired Dutch environmental scientist. To read the whole discussion, go to the comments at the end of this post. He presented me with a graphic from Dr. Robert Rohde from twitter that you can find here. It is also plotted below, as Figure 1.

Conclusion

I’m not impressed with Rohde’s display. The coefficient of correlation is decent, but it does not show that warming is controlled by changes in CO2, the temperature reversals are not explained. The reversals strongly suggest that natural forces are playing a significant role in the warming and can reverse the influence of CO2. The plots show that, at most, CO2 explains about 50% of the warming, something else, like solar changes, must be causing the reversals. If they can reverse the CO2-based warming and overwhelm the influence of CO2 they are just as strong.

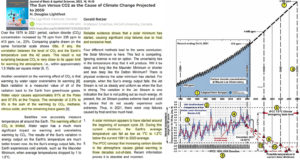
Challenging UN, Study Finds Sun—not CO2—May Be Behind Global Warming

by P. Homewood, Aug 16, 2021 in NotaLotofPeopleKnowThat


The sun and not human emissions of carbon dioxide (CO2) may be the main cause of warmer temperatures in recent decades, according to a new study with findings that sharply contradict the conclusions of the United Nations (UN) Intergovernmental Panel on Climate Change (IPCC).

The peer-reviewed paper, produced by a team of almost two dozen scientists from around the world, concluded that previous studies did not adequately consider the role of solar energy in explaining increased temperatures.

The new study was released just as the UN released its sixth “Assessment Report,” known as AR6, that once again argued in favor of the view that man-kind’s emissions of CO2 were to blame for global warming. The report said human responsibility was “unequivocal.”

But the new study casts serious doubt on the hypothesis.

Calling the blaming of CO2 by the IPCC “premature,” the climate scientists and solar physicists argued in the new paper that the UN IPCC’s conclusions blaming human emissions were based on “narrow and incomplete data about the Sun’s total irradiance.”

Indeed, the global climate body appears to display deliberate and systemic bias in what views, studies, and data are included in its influential reports, multiple authors told The Epoch Times in a series of phone and video interviews.

“Depending on which published data and studies you use, you can show that all of the warming is caused by the sun, but the IPCC uses a different data set to come up with the opposite conclusion,” lead study author Ronan Connolly, Ph.D. told The Epoch Times in a video interview.

“In their insistence on forcing a so-called scientific consensus, the IPCC seems to have decided to consider only those data sets and studies that support their chosen narrative,” he added.

The implications, from a policy perspective, are enormous, especially in this field where trillions of dollars are at stake and a dramatic re-organization of the global economy is being proposed.

Paper Examines Sun Vs. CO2

….

Greenland Ice Core CO2 during the past 1,000 years


by R. Hannon, July 2, 2021 in WUWT


Introduction
This post compares CO2 ice core measurements from Greenland to those from Antarctica over the last millennium. Paleoclimate studies typically use only Antarctic ice cores to evaluate past CO2 fluctuations. This is because the entire Greenland CO2 datasets were deemed unreliable due to chemical reactions with impurities in the ice and therefore have not been used in studies since the late 1990’s. This post will demonstrate that CO2 data from Greenland ice cores have scientific value and respond to key paleoclimate events such as the Little Ice Age and Medieval Warm Period.

Antarctic Ice Core CO2 Trends
Antarctic ice CO2 data is readily available and has been studied extensively (Bauska, 2015, Ahn, 2012, Siegenthaler, 2005 and Rubino, 2019). Most of the focus of recent studies has been on high snow accumulation sites which tend to have higher resolution and less smoothing of the trapped gas age in ice bubbles due to the firn to ice transition. Gas age width and resolution ranges from 10 years in Law Dome ice cores to 65 years in Dronning Maud Land DML. Figure 1 shows CO2 data from Antarctic high-resolution ice cores over the past millennium.

Ahn et al, 2012, compiled CO2 records from the West Antarctic Ice Sheet (WAIS) and compared them to other key datasets such as Dronning Maud Land (DML), and Law Dome. Their study recognizes and discusses elevated CO2 during the Medieval Warm Period (MWP) at 1000 AD, decrease of CO2 around 1600 AD during the Little Ice Age (LIA) and the subsequent rapid increase beginning around 1850 AD.

Gavin’s Falsifiable Science

by W. Eschenbach, Apr 2020 in WUWT


Gavin Schmidt is a computer programmer with the Goddard Institute of Space Sciences (GISS) and a noted climate alarmist. He has a Ph.D. in applied mathematics. He’s put together a twitter threadcontaining what he sees as some important points of the “testable, falsifiable science that supports a human cause of recent trends in global mean temperature”. He says that the slight ongoing rise in temperature is due to the increase in carbon dioxide (CO2) and other so-called “greenhouse gases”. For simplicity, I’ll call this the “CO2 Roolz Temperature” theory of climate. We’ve discussed Dr. Schmidt’s ideas before here on WUWT.

Now, Gavin and I have a bit of history. We first started corresponding by way of a climate mailing list moderated by Timo Hameraanta back around the turn of the century, before Facebook and Twitter.

The interesting part of our interaction was what convinced me that he was a lousy programmer. I asked him about his program, the GISS Global Climate Model. I was interested in how his model made sure that energy was conserved. I asked what happened at the end of each model timestep to verify that energy was neither created nor destroyed.

He said what I knew from my own experience in writing iterative models, that there is always some slight imbalance in energy from the beginning to the end of the timestep. If nothing else, the discrete digital nature of each calculation assures that there with be slight roundoff errors. If these are left uncorrected they can easily accumulate and bring the model down.

He said the way that the GISS model handled that imbalance was to take the excess or the shortage of energy and sprinkle it evenly over the entire planet.

Now, that seemed reasonable for trivial amounts of imbalance coming from digitization. But what if it were larger, and it arose from some problem with their calculations? What then?

So I asked him how large that energy imbalance typically was … and to my astonishment, he said he didn’t know.

Amazed, I asked if he had some computer version of a “Murphy Gauge” on the excess energy. A “Murphy Gauge” (below) is a gauge that allows for Murphy’s Law by letting you set an alarm if the variable goes outside of the expected range … which of course it will, Murphy says so. On the computer, the equivalent would be something in his model that would warn him if the excess or shortage of energy exceeded some set amount.

Molecular and isotopic evidence reveals the end-Triassic carbon isotope excursion is not from massive exogenous light carbon

by C.P. Fox et al., Dec 1, 2020 in PNAS


Significance

The end-Triassic mass extinction that occurred ∼202 Ma is one of the “Big Five” biotic crises of the Phanerozoic Eon. It is also accompanied by an organic carbon isotopic excursion that has long been interpreted as the result of a global-scale carbon-cycle disruption. Rather than being due to massive inputs of exogenous light carbon into the ocean–atmosphere system, the isotopic excursion is shown here to reflect regional sea-level change that caused a transition from a marine ecosystem to a less saline, shallow-water, microbial-mat environment and resultant changes in the sources of organic matter. The mass extinction that occurred slightly later, caused by abrupt injection of volcanogenic CO2, is accompanied by only modest changes in organic carbon isotopic composition.

Abstract

The negative organic carbon isotope excursion (CIE) associated with the end-Triassic mass extinction (ETE) is conventionally interpreted as the result of a massive flux of isotopically light carbon from exogenous sources into the atmosphere (e.g., thermogenic methane and/or methane clathrate dissociation linked to the Central Atlantic Magmatic Province [CAMP]). Instead, we demonstrate that at its type locality in the Bristol Channel Basin (UK), the CIE was caused by a marine to nonmarine transition resulting from an abrupt relative sea level drop. Our biomarker and compound-specific carbon isotopic data show that the emergence of microbial mats, influenced by an influx of fresh to brackish water, provided isotopically light carbon to both organic and inorganic carbon pools in centimeter-scale water depths, leading to the negative CIE. Thus, the iconic CIE and the disappearance of marine biota at the type locality are the result of local environmental change and do not mark either the global extinction event or input of exogenous light carbon into the atmosphere. Instead, the main extinction phase occurs slightly later in marine strata, where it is coeval with terrestrial extinctions and ocean acidification driven by CAMP-induced increases in PCO2; these effects should not be conflated with the CIE. An abrupt sea-level fall observed in the Central European basins reflects the tectonic consequences of the initial CAMP emplacement, with broad implications for all extinction events related to large igneous provinces.

No Mention Of CO2: New Study Shows African Climate Variability Strongly Linked To Natural Cycles

by C. Rotter, March 5, 2021 in WUWT


Africa climate variability linked to natural oceanic and solar cycles, a new study affirms. No mention of CO2. 

Understanding natural cycles the key to model projections

Sufficient rainfall is the basic condition for high-yield agriculture and food security for the population. Until recently, however, it was not possible to reliably predict rainfall several months in advance, which repeatedly led to unexpected crop failures. For some years now, however, progress has been emerging. The literature has repeatedly reported exciting correlations between temperature and air pressure patterns on the world’s oceans with rainfall and droughts in Africa and on other continents.

A group of researchers led by Horst-Joachim Lüdecke wanted to know more and meticulously searched for patterns in the monthly rainfall data of 49 African countries for the period 1901 to 2017 using statistical methods.

“Large number of robust correlations”

The scientists compared the rainfall fluctuations with five oceanic indices of natural origin that are firmly established in science, as well as with solar activity. The evaluation revealed a large number of robust correlations across the African continent with characteristic seasonal patterns. It has been known for some time that the Atlantic Ocean influences precipitation in Morocco and the Sahel via the so-called Atlantic Multidecadal Oscillation (AMO) and North Atlantic Oscillation (NAO). In East Africa, influences from the Indian and Pacific Oceans have been reported so far.

Climate Researcher’s New E-Book: IPCC Significantly Overstates CO2, “The Sorry State Of Climate Science”

by P. Gosselin, Feb 5, 2021 in NoTricksZone


This is an outstanding reference. Using the table of contents the reader can conveniently look up the topic that’s of interest. The ebook has been downloaded over 10,000 times so far.

The 449-page book contains 120 figures and 177 equations and concludes that climate change is mostly about politically-fanned fear, and based very little on hard science.

Predictions of gloom haven’t come true

According to Poyet, a geologist, the worse climate predictions have been made for 50 years and none of them has ever become true. For example, despite the unsupported claims that the Maldives islands would be submerged by 2050, 97% of them have grown so far, for various reasons having nothing to do with “climate change”.

Also 50 years ago, the first Earth Day promoted ice age fears, and environmentalist Nigel Calder (later a prominent AGW skeptic) warned: “The threat of a new ice age must now stand alongside nuclear war as a likely source of wholesale death and misery for mankind.”

IPCC ignores vast majority of the science

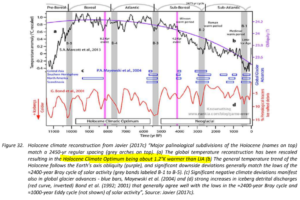
While IPCC-affiliated scientists claim man to been behind the climate change of the past decades, Poyet’s book shows that this can only be concluded if one ignores all other factors. Fig 12, of his book, for example, depicts the natural fluctuations witnessed during the Holocene.


Solving the mystery of why atmospheric carbon dioxide was lower during ice ages

by M. Floyd, June 13, 2019 in PhysOrg


Since scientists first determined that atmospheric carbon dioxide (CO2) was significantly lower during ice age periods than warm phases, they have sought to discover why, theorizing that it may be a function of ocean circulation, sea ice, iron-laden dust or temperature.

Yet no based on existing evidence has been able to explain why CO2 levels were as much as one-third lower when an ice age settled in.

A new study published this week in Science Advances provides compelling evidence for a solution—the combination of sea water variation and iron from dust off Southern Hemisphere continents.

The IR absorptive characteristics of “greenhouse” gases–David Coe

by P. Homewood, Jan 17, 2021 in NotaLotofPeopleKnowThat


SUMMARY

Using well documented data on the infra-red absorption spectra of atmospheric gases it is a straight-forward process to infer the overall atmospheric IR absorption and from that the effective global average temperature. The simplest of atmospheric models has been used: the atmosphere is considered to be a uniform thin absorbing layer of gas. The results demonstrate clearly that the warming effect of the atmosphere is almost entirely due to the spectral absorption characteristics of CO2 and H2O. They are both exceptionally strong absorbers of infra-red radiation. It is however this strength which determines the characteristics of the earth’s temperature, and in particular its stability.

70% of the energy radiated from the earth is removed by a mixture of 0.1% H2O and 200ppm of CO2. This alone is sufficient to raise global temperatures from the chilly 255K of the estimated zero atmosphere condition to 284.3K, less than 4deg below current average temperatures. An estimation of the current atmospheric mixture of gases is calculated to deliver a global mean temperature of 286.8K close to the best estimate of 288K for that temperature. Further increases in both H2O and CO2 have relatively small impacts on temperatures. This is due simply to the fact that at current concentrations the spectra of both H2O and CO2 have effectively extracted most of the energy at wavebands corresponding to their molecular absorption spectra. There is little further energy to be extracted by adding more H2O and CO2. This results in climate sensitivity values of less than 0.5degC, in comparison to the 1.5 to 5 degC range quoted by the IPCC.

CO2 levels of 3000ppm will only raise temperatures by a further 1.5K. These temperature increases are in fact well within natural variations seen in the past, including the medieval warm period and the little ice age of some 300 years ago.

The possibility of positive feedback from water vapour is discounted by the simple fact that the H2O spectrum is incapable of absorbing significant further amounts of radiated energy and the modest increase in temperature due to increasing CO2 levels is unable to deliver any significant increase in H2O concentration due to the specific relationship of H2O saturation vapour pressure and temperature. It would take an increase in temperature of 10degC to double the mean H2O atmospheric concentration, and that doubling would only result in a temperature increase of 2degC.

The impact of other known “greenhouse’ gases, CH4 and N2O are also calculated from known IR spectra data. Their absorption spectra are swamped by H2O and CO2. The combined warming caused by current atmospheric concentrations will elevate temperature by only 0.2K and increasing concentrations by a factor of 10 will only result in a further temperature increase of 0.5K.

The “greenhouse effect” is dominated by the absorption spectrum of H2O with a little help from CO2. At current concentrations of both gases it is inconceivable that further increases in concentrations will lead to any significant warming. Increasing CO2 concentration to 3000ppm and doubling the mean H2O level to 2% would result in a global temperature increase of 3.4K.

In short, there is no climate emergency, at least due to “greenhouse gases”.

 The full paper can be read here:

co2-the-miracle-molecule-22637

See this Addendum

Very Inconvenient Alps Glacier History…Top Glaciologists: Alps Were Ice-Free 6000 Years Ago

by C. Rotter, Jan 7, 2021 in WUWT


Alps ice-free…6000 years ago, when CO2 was much lower than today’s levels.

Dr. Sebastian Lüning earlier today released his latest Klimaschau report, No. 6. In the first part he looks at glaciers in the Alps over the course of much the Holocene.

See the video

It turns out that Most of the Alps were ice-free 6000 years ago, glaciologists have discovered.

In his video, the German geologist presents a new paper authored by glaciologists Bohleber et al, 2020 of the Austrian Academy of Science. The Austrian-Swiss team discovered from ice cores that the 3500-meter high Weißseespitze summit was ice free 5900 years ago.

Much warmer in the early Holocene

Lüning next shows why the Alps were ice-free 6000 years ago by using a chart by Heiri et al 2015, which shows it was some 2°C warmer than today.

2020 Review: Observational And Modeling Studies Show Temperature Falls As CO2 Rises

by K. Richard, Dec 28, 2020 in NoTricksZone


A 2020 observational study (Zhang et al., 2020) determined “temperatures of atmospheric air with substantially higher CO2 concentration (ranging from 3200 ppm to 16,900 ppm) were lower than that with the lower CO2 concentration (480 ppm)” and a 2020 modeling study (Drotos et al., 2020) assessed that when CO2 goes beyond 4 times preindustrial – 1,120 ppm – “climate sensitivity decreases to nearly zero” because the climate cyclically cools by 10 K.

So the science is settled, right?


….

CO2 Coalition: “The Global Mean Temperature Anomaly Record How it works and why it is misleading”

by D. Middleton,  Dec 8, 2020 in WUWT


Our friends at the CO2 Coalition have published another excellent report.

This white paper by Richard Lindzen and John Christy explores the global mean temperature anomaly record. Their focus isn’t on whether it’s right or wrong; it’s on its significance relative to natural variability and its inherently low signal-to-noise ratio. Here’s the executive summary:

STUDIES AND RESOURCES, WHITE PAPERS AND OTHER PUBLICATIONS

4 DEC, 2020
The Global Mean Temperature Anomaly Record
How it works and why it is misleading

by Richard S. Lindzen and John R. Christy

The CO2 Coalition is honored to present this Climate Issues in Depth paper by two of America’s most respected and prolific atmospheric physicists, MIT professor emeritus Richard Lindzen, who is a longtime member of the Coalition, and University of Alabama in Huntsville professor John Christy.

Professor Lindzen has published over 200 scientific articles and books over a five-decade career. He has held professorships at the University of Chicago, Harvard University and MIT. He is a fellow and award recipient of the American Meteorological Society and the American Geophysical Union. He is also a member of the National Academy of Science and was a lead author of the UN IPCC’s third assessment report’s scientific volume. His research has highlighted the scientific uncertainties about the impact of carbon dioxide emissions on temperature and climate more generally.

Professor Christy, the director of the Earth System Science Center at The University of Alabama in Huntsville, began studying global climate issues in 1987. He has been Alabama’s State Climatologist since 2000 and a fellow of the American Meteorological Society since 2002. He and CO2 Coalition member Dr. Roy W. Spencer developed and have maintained one of the key global temperature data sets relied on by scientists and government bodies, using microwave data observed in the troposphere from satellites since 1979. For this achievement, they were awarded NASA’s Medal for Exceptional Scientific Achievement.

The purpose of this paper is to explain how the data set that is referred to by policy-makers and the media as the global surface temperature record is actually obtained, and where it fits into the popular narrative associated with climate alarm.

Executive Summary
At the center of most discussions of global warming is the record of the global mean surface temperature anomaly—often somewhat misleadingly referred to as the global mean temperature record. This paper addresses two aspects of this record. First, we note that this record is only one link in a fairly long chain of inference leading to the claimed need for worldwide reduction in CO2 emissions. Second, we explore the implications of the way the record is constructed and presented, and show why the record is misleading.

This is because the record is often treated as a kind of single, direct instrumental measurement. However, as the late Stan Grotch of the Laurence Livermore Laboratory pointed out 30 years ago, it is really the average of widely scattered station data, where the actual data points are almost evenly spread between large positive and negative values.

The average is simply the small difference of these positive and negative excursions, with the usual problem associated with small differences of large numbers: at least thus far, the one-degree Celsius increase in the global mean since 1900 is swamped by the normal variations at individual stations, and so bears little relation to what is actually going on at a particular one.

In Geological Terms, Today’s Atmospheric CO2 Concentrations Are Still Uncomfortably Low

by P. Gosselin, Dec 5, 2020 in NoTricksZone


Under 180 ppm atmospheric CO2 concentration, life on earth begins to die.

The earth came very close to that point not long ago during the Ice Ages (20,000 years ago). Then the planet warmed naturally, and an increase in atmospheric CO2 to over 200 ppm followed (new study here).

The earth saw CO2 levels of close to 8000 ppm in the past, i.e. about 20 times more than today. The following chart shows the earth’s atmospheric CO2 concentrations for the past 600 million years.

Today, thanks in large part to mankind, concentrations have risen to over 400 ppm, yet historically this remains at the very low end of the scale compared to the thousands of ppm seen naturally earlier in history.

Greening planet

Today, definitely a safer level would be near 1000 ppm. Studies unanimously show plant growth at these higher levels is far enhanced. Already today we see clear evidence the planet is greening Zhu et al. (2016), in part due to the fertilizations taking place through human emissions:

Physicists: A CO2 Rise To 800 ppm Causes ‘Hypothetical’ 10°C Upper Atmosphere Cooling, 1.4°C Surface Warming

by Wijnagaarden & Happer, Nov 26, 2020 in NoTricksZone


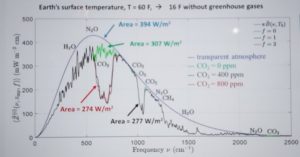
At the current concentrations, the forcing power for greenhouse gases like CO2 (~400 ppm) and CH4 (1.8 ppm) are already saturated. Therefore, even doubling the current greenhouse gas concentrations may only increase their forcings “by a few percent” in the parts of the atmosphere where there are no clouds. When clouds are present, the influence of greenhouse gases is even further minimized.

While the “consensus” model view is that doubling CO2 from 280 ppm to 560 ppm results in a surface forcing of 3.7 W/m², Wijngaarden and Happer find doubling CO2 concentrations from 400 to 800 ppm increases climate forcing by 3 W/m². This warms the surface by 1.4 K as it “hypothetically” cools the upper atmosphere by 10 K.

Equilibrium climate sensitivity (when positive feedback with water vapor is included) is identified as 2.2 K, which is within 10% of multiple other analyses.

Study suggests no more CO2 warming

by C. Rotter, Oct 26, 2020 in WUWT


By David Wojick |October 26th, 2020|Climate

Precision research by physicists William Happer and William van Wijngaarden has determined that the present levels of atmospheric carbon dioxide and water vapor are almost completely saturated. In radiation physics the technical term “saturated” implies that adding more molecules will not cause more warming.

In plain language this means that from now on our emissions from burning fossil fuels could have little or no further impact on global warming. There would be no climate emergency.  No threat at all. We could emit as much CO2 as we like; with no effect.

This astounding finding resolves a huge uncertainty that has plagued climate science for over a century. How should saturation be measured and what is its extent with regard to the primary greenhouse gases?

In radiation physics the term “saturation” is nothing like the simple thing we call saturation in ordinary language, just as the greenhouse effect is nothing like how greenhouses work. Your paper towel is saturated when it won’t pick up any more spilled milk. In contrast greenhouse gases are saturated when there is no more milk left to pick up, as it were, but it is far more complex than this simple analogy suggests.

Happer is probably best known to our readers as a leading skeptical scientist. He co-founded the prestigious CO2 Coalition and recently served on the staff of the National Security Council, advising President Trump. But his career has been as a world class radiation physicist at Princeton. His numerous peer reviewed journal articles have collectively garnered over 12,000 citations by other researchers.

In this study Professors Happer and van Wijngaarden (H&W) have worked through the saturation physics in painstaking detail. Their preprint is titled “Dependence of Earth’s Thermal Radiation on Five Most Abundant Greenhouse Gases“. They have gone far beyond the work done to date on this complex problem.

To begin with, while the standard studies treat the absorption of radiation by greenhouse molecules using crude absorption bands of radiation energy, H&W analyze the millions of distinct energies, called spectral lines, which make up these bands. This line by line approach has been an emerging field of analysis, often giving dramatically new results.

….

….

Clearly this is work that the climate science community needs to carefully consider. This may not be easy given that three major physics journals have refused to publish it. The reviews have been defensive and antagonistic, neither thoughtful nor helpful. Alarmism is in control of the journals, censoring contrary findings, hence the preprint version.

Roger Revelle – the backstory of the father of Atmospheric CO2 monitoring

by A. May, Oct 321, 2020 in WUWT


Roger Revelle was an outstanding and famous oceanographer. He met Al Gore, in the late 1960s, when Gore was a student in one of his classes at Harvard University. Revelle was unsure about the eventual impact of human carbon dioxide emissions on climate, but he did show that all carbon dioxide emitted by man would not be absorbed by the oceans. For an interesting discussion of Revelle’s work in this area see this post on “The Discovery of Global Warming,” by Spencer Weart (Weart, 2007). The original paper, on CO2 absorption by the oceans, published in 1957 by Roger Revelle and Hans Suess, is entitled: “Carbon Dioxide Exchange Between Atmosphere and Ocean and the Question of an Increase of Atmospheric CO2, during the Past Decades” (Revelle & Suess, 1957). This meant that human emissions of carbon dioxide would accumulate in the atmosphere and that the CO2 atmospheric concentration would increase, probably causing Earth’s surface to warm at some unknown rate. This is not an alarming conclusion, as Revelle well knew, but Al Gore turned it into one.

One of Revelle’s good friends was Dr. S. Fred Singer. Singer was a professor of environmental science at the University of Virginia and both Revelle and Singer had been science advisors in the U.S. Department of the Interior. They first met in 1957 and were more than professional colleagues, they were personal friends (Singer, 2003). Unfortunately, Revelle passed away in July 1991 and Singer passed away in April 2020, so we will refer to them and their friendship in the past tense. Both were leading Earth scientists and at the top of their fields, it was natural they would become friends. They also shared an interest in climate change and chose to write an article together near the end of Revelle’s life.


Indeed, ten years later, CO2 emissions were still increasing, but the world had started to cool as shown in Figure 1. This casts considerable doubt on the idea that human emissions somehow control global warming, since some other factor, presumably natural, is strong enough to reverse the overall warming trend for ten years. Revelle was correct to encourage the government to wait for ten more years. Just a year before their paper was published the IPCC reported that warming to date fell within the range of “natural variability” and that the detection of a human influence on climate was “not likely for a decade or more.” (IPCC, 1990, p. XII).

Figure 1. In 1990 and 1991, respectively, the IPCC and Roger Revelle and colleagues said it was too early to do anything about possible man-made climate change, they thought we would know more in 10 years. The plot is smoothed with a 5-year running average to reduce the effect of El Nino and La Nina events. This makes the longer term trends easier to see.

Is Mauna Loa Really The Best Location To Measure ‘Global’ CO2 Levels?

by K. Richard, Oct 19, 2020 in NoTricksZone


Highly anomalous terrain (an active volcano), 40 years of cooling temperatures, and a CO2 record that dramatically contrasts with fluctuating values from forests and meadows reaching 600-900 ppm all beg the question: Is Mauna Loa’s CO2 record globally representative?

Mauna Loa is the Earth’s largest land volcano. It has erupted over 3 dozen times since 1843, making this terrestrial landscape extremely unusual relative to the rest of the globe’s terrain. (Forests, in contrast, cover over 30% of the Earth’s  land surface.)

Mauna Loa has been thought to be the world’s best location to monitor global CO2 levels since 1958.

While Mauna Loa CO2 levels show a rise of 338 ppm to 415 ppm since 1980, Mauna Loa temperatures (HCN) show a cooling trend during this same time period. The only warming period in the last 65 years occurred between about 1975 and 1985.

Image Source: oz4caster

Forest CO2 fluctuations

As mentioned above, forests are orders of magnitude more terrestrially representative than the highly anomalous site of the Earth’s largest volcano.

In forests or tree-covered areas, CO2 rises from around 300 ppm in the warmth of the afternoon (~3 p.m.) to over 600 ppm before sunrise (~4 a.m.), when it is cooler (Fennici, 1986, Hamacher et al., 1994). This massive fluctuation occurs daily and CO2 values average out to be far higher than the Mauna Loa record suggests.

The Great Energy Non-Transition

by B. Everett, Oct 15, 2020 in CO2Coalition


One of the troubling characteristics of today’s civic discourse is the tendency to confuse predictions with reality.  Nowhere is this problem more severe than in the debate over climate and its associated issues.

The last hundred years have seen increasing emissions of carbon dioxide – a benign gas.  In reality, this slight increase in atmospheric COconcentrations (from 0.03% in the nineteenth century to 0.04% today) has brought nothing but beneficial effects, including increased crop yields and greater drought resistance.  Nonetheless, climate alarmists argue that rising temperatures are bringing catastrophic storms, flooding, disease, inundation, extinction and general misery.  Unlike the benefits of CO2 which are clear and measurable, climate catastrophe remains nothing more than a prediction generated by computer models which have never produced meaningful forecasts of climate impacts.

A frequent corollary of climate alarmism is that the world has undertaken a radical transformation of the global energy system away from fossil fuels toward zero-carbon, renewable energy.  A Google search of the term “energy transition” yields over 5 million hits, many accompanied by terms such as “unstoppable” and “irreversible”.  But is this transition actually taking place? Three arguments are generally offered – none of them valid.

First, “energy transition” supporters point to the high growth rates for renewable energy sources with wind increasing at over 20% annually since 2000 and solar at over 40% per year, compared to less than 2% for fossil fuels.  Sounds great, but the absolute numbers tell a different story.  In 2019, despite forty years and trillions of dollars of subsidies, wind energy contributes about 2% of total global energy use and solar just over 1%.  Fossil fuels accounted for 84%, down just two percentage points over the last 20 years.