Archives par mot-clé : LIA

Antarctica Is Colder, Icier Now Than Any Time In 5000 Years. The Last Warm Period Was 1000 Years Ago.

by K. Richard, Apr 15, 2024 in NoTricksZone


More evidence emerges that Antarctica has undergone rapid glacier and sea ice expansion in recent centuries, in line with the long-term and recent Antarctic cooling trend.

West Antarctica’s mean annual surface temperatures cooled by more than -1.8°C (-0.93°C per decade) from 1999-2018 (Zhang et al., 2023).

Not just West Antarctica, but most of the continent also has cooled by more than 1°C in the 21st century. See, for example, the ~1°C per decade cooling trend for East Antarctica (2000 to 2018) shown in Fig. ES


According to a new study, about 6000 years ago Antarctica’s Collins Glacier’s frontline was a full 1 km southwest of its current extent. The frontline advanced to today’s extent ~5000 years ago.

“Previous studies proposed that 6000 yr BP, the frontline position of the Collins Glacier was located 1 km further south west than the present, and that the current frontline was first attained at approximately 5000 yr BP.”

The glacier then continuously retreated south of the modern extent for another 4000 years, with peak ice loss 1000 years ago (as shown in the 1000-year “Proglacial lake environment” image). In the last 1000 years this glacier has rapidly re-advanced back to the glaciated extent from 5000 years ago, which is in line with the sustained cooling trend ongoing since the Medieval Warm Period.

Three More New Temperature Reconstructions Document A Warmer Medieval Period

by K. Richard, Apr 11, 2024 in NoTricksZone


he North Atlantic, the Pacific Northwest (USA), and northern Finland were all warmer than today between 1000 and 2000 years ago.

Today’s (2000 CE) July air temperatures in the Azores – archipelago islands in the middle North Atlantic, ~1400 km west of Portugal – are visually shown to average about 10 to 11°C in a newly published reconstruction (Raposeiro et al., 2024).

This average air temperature is about 1 to 2°C warmer than this location’s Little Ice Age climate, or the coldest period (~9.1°C from 1750-1800) of the last 2000 years. However, the Medieval Climate Anomaly (MCA) had temperatures reaching into the 13-15°C range, which is 3-4°C warmer than modern.


A temperature reconstruction from a lake in the USA’s Pacific Northwest (Baig, 2024) indicates glacial temperatures were only 1.0 to 1.6°C colder than the modern temperature, 12.2°C. Temperatures reached 13.7°C, or 1.5°C warmer than today, ~2500 years ago, and then fluctuated between 12.6 and 12.2°C from 1900 years ago until today, a period encompassing both the Medieval Warm Period and Little Ice Age.

Another lake sediment temperature reconstruction using branched glycerol dialkyl glycerol tetraethers (brGDGTs) from northern Finland (Otiniano et al., 2024) suggests the modern temperature (represented as the blue diamond) is among the coldest of the last ~8000 years. Temperatures were much warmer than modern about 1200 to 1500 years ago, and throughout the period from 7000 to 3000 years ago.

2 More New Studies Undermine Alarmist Claims That Corals Are Harmed By Warming

by K. Richard, Dec 21, 2023 in NotricksZone


Warmer sea surface temperatures are associated with coral growth, not decline.

According to a new study, coral growth was slow during the ~1°C colder Little Ice Age (LIA), but grew rapidly as sea surface temperatures (SSTs) warmed after 1850. Warmth is associated with coral growth, whereas colder SSTs are linked to growth rate decline.

“The average growth rate of four colonies living in the LIA is 0.87 ± 0.11 cm/yr, which is significantly (t-test, p < 0.0001) lower than the colonies in the 20th century [1.23 ± 0.22 cm/yr].”

“The observed low average growth rates during the LIA can be explained by the ~1°C lower temperature.”

Ocean pH levels were as low or lower (more “acidified”) than recent decades during the LIA (e.g., 1500s to 1700s CE), suggesting that the atmospheric CO2 levels are not an ocean pH variability determinant. In fact, the authors point out that anthropogenic CO2 can only ever affect pH variability by 0.05 of a unit over centuries, whereas natural variations in pH units can reach 0.1 to 0.3 within a decade or less.

In Climatology, Whatever Happened To Evidence-Based Science?

by J. Hellner, Nov 21, 2023 in ClimateChangeDispatch


Isn’t it time that journalists and students are taught to do research and ask questions about the climate instead of just regurgitating talking points pushing the green agenda?

We are constantly told that storms, floods, droughts, and other natural disasters are growing in frequency and intensity—so why don’t we see specific examples? [emphasis, links added]

Like the severe drought and warm period in Europe in 1540 when temperatures were 9–13 degrees above today’s averageduring the Little Ice Age?

For eleven months, there was practically no rain, and temperatures were five to seven degrees [Celsius] [9–13°F] above the normal values of the 20th century; in many places, summer temperatures must have exceeded 40°C (104°F).

Many forests in Europe went up in flames, choking smoke darkened the sun, and not a single thunderstormwas reported in the summer of 1540.

Water was already scarce in May, wells and springs dried up, mills stood still, people starved, and livestock was slaughtered. Estimates are that in 1540, half a million people died, mostly from dysentery.

Or what about the massive fires in the United States in 1871? In 1871, the Midwestern United States had a severe drought and warm weather, clearly not caused by humans and our use of natural resources.

As a result of this heat and drought, there were severe fires throughout the Midwest, including the Great Chicago Fire.

The temperature was 85 degrees on October 8, 1871. This year the high was 55 degrees, or thirty degrees cooler.

Why isn’t Chicago warmer, after 152 years, with all the cement, people, and gas vehicles and equipment if they all cause warming?

The Chicago fire alone caused $200 million in damages, which is the equivalent of over $5 billion today.

I am 70 years old, and I don’t recall serious fires during my lifetime in the Midwest.

The narrative that humans and our use of natural resources are to blame for warming temperatures, in turn creating an existential threat to our survival, is contrary to the data and facts; scientific honesty would be forming a narrative based on the evidence, instead of forcing “evidence” to fit a story.

What about the Medieval Warm Period 1,000 years ago where temperatures were similar to today? What caused that warming since it clearly wasn’t man’s use of natural resources?

New Reconstructions From Brazil, China, Europe Indicate No Net Warming In Recent Centuries

by K. Richard, Oct 26, 2023 in NoTricksZone


Paleoclimate studies continue to undermine claims of “unprecedented” global warming in the modern era.

A new temperature reconstruction (Oliveira Silva Muraja et al., 2023) for Brazil reveals there has been no net modern warming since the 1400s.


Another new temperature reconstruction (Yue et al., 2023) indicates there has been no net modern warming in Central China since the 1400s.

Russian Temperature Records Are Not Cooperating With The CO2-Driven Climate Narrative

by K. Richard, Nov 14, 2022 in NoTricksZone


Two new studies indicate there has been no modern warming in the last centuries in western (Urals) and eastern (Kolyma) Russian mountain ranges.

A new 27,000-year temperature reconstruction assesses it was ~2.5 to 4.8°C warmer than today from 8.9-5.2 ka BP in the Ural Mountains, or when CO2 is said to have hovered in the 265 ppm range.

Summer temperatures were also warmer during the Medieval Warm Period, or from 1.2-0.7 ka BP. After a post-Medieval cool-down fostering in the Little Ice Age, the reconstructed record suggests there has been no warming since 0.5 cal ka BP, or for the last several centuries.

The smoothed temperature record shown in the study indicates there was only one brief period in the last 10,000 years that was not warmer than today.

“The reconstructed TJuly [8.9-5.2 cal ka BP] are the highest recorded, reaching up to 4.8 °C higher than today’s air temperature. … Present day T July have persisted since 0.5 cal ka BP.”

“New Little Ice Age Instead of Global Warming?” — Dr Theodor Landscheidt

by Cap Allon, Aug 7, 2022 in Elecroverse

[Originally published Sept 7, 2020 on electroverse.net]

Among the long list or scientific papers suggesting that a solar-driven spell of global cooling is on the cards, Dr Theodor Landscheidt’s ‘New Little ICE Age Instead of Global Warming?‘ probably has the claim of priority.

Published in 2003, just a year before his death, Landscheidt’s research is standing the test of time, and is still largely on course to be proved correct.

The paper’s abstract begins:

‘Analysis of the sun’s varying activity in the last two millennia indicates that contrary to the IPCC’s speculation about man-made global warming as high as 5.8C within the next hundred years, a long period of cool climate with its coldest phase around 2030 is to be expected.’

Crucially, in the growing list of research concluding that a solar-driven multidecadal spell of global cooling is on the cards (research from multiple studies of quite different characteristics), the year 2030 ALWAYS features prominently. Unlike the IPCC, which tosses its thermageddon doomsday date back and forth like a hot potato, researchers who track the multimillennial plays of the cosmos (namely those of the Sun) routinely land on the year 2030 as being the date of ‘climate deterioration’: this in itself should serve as compelling evidence.

Dr Landscheidt continues:

‘It is shown that minima in the 80 to 90-year Gleissberg cycle of solar activity, coinciding with periods of cool climate on Earth, are consistently linked to an 83-year cycle in the change of the rotary force driving the sun’s oscillatory motion … As the future course of this cycle and its amplitudes can be computed, it can be seen that the Gleissberg minimum around 2030 and another one around 2200 will be of the Maunder minimum type accompanied by severe cooling on Earth. This forecast should prove skillful as other long-range forecasts of climate phenomena, based on cycles in the sun’s orbital motion, have turned out correct as for instance the prediction of the last three El Niño years before the respective event.’

Climate Monitoring Since The Little Ice Age

by P. Homewood, July 19, 2022 in NotaLotofPeopleKnowThat


Meanwhile the jokers at the Met Office don’t seem to have realised that their temperature records begin at the depth of the Little Ice Age, or appear to have heard about Urban Heat Islands

It is mid July 2022. We are currently experiencing a significant – at the time of writing provisionally record-breaking – heatwave for the UK. Red weather warnings for extreme heat are in force for large parts of England and forecasts indicated a real possibility of temperatures reaching up to 40°C in some areas. Indeed, this temperature has already been exceeded. Whether or not records are broken, a key part of the work that we do at the Met Office is climate monitoring, an important aspect of which is the ability to put current weather into historical context. Climate monitoring serves many functions: It can effectively communicate the relative severity of an event; it can indicate how frequently such extremes are likely to occur; and it can monitor how the character or frequency of extremes are changing over time. In order to properly understand the risks from climate change, a key research question climate monitoring can help us to answer is, ‘What are the current weather and climate hazards, risks and impacts that should be expected in the UK and globally?’. To address this question, we must look to the past, and the scientific effort goes back further than you might think.

Making history

In 1663, Robert Hooke stood before the relatively newly formed Royal Society and proposed ‘A method for making the history of the weather’. Hooke and other notable scientists of the time were actively developing instruments capable of making meteorological measurements of wind, rain, air pressure, humidity and temperature. These were the early anemometers, rain gauges, barometers and thermometers of the time1. In his paper, Hooke recommended what should be measured and how it should be recorded, including ‘a scheme at one view representing to the eye the observations of the weather for a month’ and implored his colleagues to undertake such measurements. From a modern climatologist’s point of view, arguably one of the most important advances by Hooke was his recognition that if systematic and consistent measurements were made across the country, or even across the world, then an international perspective on the weather could be obtained, for the benefit of humankind. 

The Two Degree Limit

by Andy May, July 19, 2022 in WUWT


For decades We have been told that we must not let global warming exceed two degrees Celsius above the “pre-industrial” global average temperature. Recently the IPCC lowered this limit to 1.5°C. In the latest IPCC report, called AR6, pre-industrial is defined as before 1750, but they use global temperatures from 1850-1900 as representative of the period because global average surface temperatures are not available for 1750.[1] The U.S., Europe, and much of Asia were industrialized by 1900, so their numbers are clearly not representative of the period of interest, unless temperatures remained constant from 1750 to 1900, which is unlikely.

Why the focus on 2°? In a 2014 comment in Nature, David Victor and Charles Kennel tell us that there is little scientific basis for the 2°C figure, but it was a simple focal point and it “sounded bold and perhaps feasible.” (Victor & Kennel, 2014). Then they admit the goal is “effectively unachievable.”

What is the “pre-industrial?” Did it have an ideal climate that we wish to return to? The year 1750 was in the coldest and most miserable part of the Little Ice Age (LIA). The LIA was the coldest period in the Holocene Epoch, or since the last glacial period ended about 12,000 years ago, at least in much of the Northern Hemisphere.

New Study: 2000-Year Precipitation Reconstructions Expose Climate Models Still Of Junk Grade

by Atwood et al., Aug 18, 2021 in NoTricksZone


A new study by Atwood et al (2021) published in the journal of Paleoceanography and Paleoclimatology found there’s “poor agreement” between precipitation reconstructions and model simulations over the past 2000 years. This means future projections made by current models are unreliable. 


Models and reconstructions don’t agree

These comprehensive reconstructions show that from 800 to 1000 CE there was a pronounced drying event relative from the eastern Pacific and parts of Mesoamerica.

Also the period “1400–1700 CE is marked by pronounced hydroclimate changes across the tropics, including dry and/or isotopically enriched conditions in South and East Asia, wet and/or isotopically depleted conditions in the central Andes and southern Amazon in South America, and fresher and/or isotopically depleted conditions in the Maritime Continent.”

The study’s abstract also notes how there’s a glaring disagreement between the simulations done by models and what the reconstructions show: “We find notable dissimilarities between the regional hydroclimate changes and global-scale and hemispheric-scale temperature reconstructions, indicating that more work needs to be done to understand the mechanisms of the widespread tropical hydroclimate changes during the LIA.”

Greenland Ice Core CO2 during the past 1,000 years


by R. Hannon, July 2, 2021 in WUWT


Introduction
This post compares CO2 ice core measurements from Greenland to those from Antarctica over the last millennium. Paleoclimate studies typically use only Antarctic ice cores to evaluate past CO2 fluctuations. This is because the entire Greenland CO2 datasets were deemed unreliable due to chemical reactions with impurities in the ice and therefore have not been used in studies since the late 1990’s. This post will demonstrate that CO2 data from Greenland ice cores have scientific value and respond to key paleoclimate events such as the Little Ice Age and Medieval Warm Period.

Antarctic Ice Core CO2 Trends
Antarctic ice CO2 data is readily available and has been studied extensively (Bauska, 2015, Ahn, 2012, Siegenthaler, 2005 and Rubino, 2019). Most of the focus of recent studies has been on high snow accumulation sites which tend to have higher resolution and less smoothing of the trapped gas age in ice bubbles due to the firn to ice transition. Gas age width and resolution ranges from 10 years in Law Dome ice cores to 65 years in Dronning Maud Land DML. Figure 1 shows CO2 data from Antarctic high-resolution ice cores over the past millennium.

Ahn et al, 2012, compiled CO2 records from the West Antarctic Ice Sheet (WAIS) and compared them to other key datasets such as Dronning Maud Land (DML), and Law Dome. Their study recognizes and discusses elevated CO2 during the Medieval Warm Period (MWP) at 1000 AD, decrease of CO2 around 1600 AD during the Little Ice Age (LIA) and the subsequent rapid increase beginning around 1850 AD.

Claim: The Temperature Spike Just Prior to the Little Ice Age can Teach Us about Modern Global Warming

by E. Worall, Jan 7, 2021 in WUWT


According to Patric Seifert, a tropospheric researcher at the Leibniz Institute in Germany, a large scale temperature spike occurred just before the onset of the Little Ice Age. Seifert does not think global temperatures are about to crash, but he thinks conditions in Europe are similar enough to the 14th century that historical reconstructions of this medieval heatwave, the Dantean Anomaly, can help us understand what we will face as the world continues to warm.

Extreme 14th Century Droughts May Provide Insight Into Our Climate Change Crisis 

CARLY CASSELLA
9 JANUARY 2021

Scientists are studying a major, once-in-a-century drought from Medieval Europe to better understand how extreme weather events indicate rapid climate changes.

In the years leading up to the Little Ice Age, between 1302 and 1307, many regions on the European continent were facing exceptional heat and drought, according to historical records and data collected from tree rings and sediment cores.

These extreme natural events, while not driven by human emissions, hold similar characteristics to recent weather anomalies, and they could help us better predict the course of modern-day climate change.

“Even if it was a phase of cooling in the Middle Ages and we are now living in a phase of [hu]man-made warming, there could be parallels,” says Patric Seifert, a tropospheric researcher at the Leibniz Institute in Germany.

“The transitional period between two climate phases could be characterized by smaller temperature differences between the latitudes and cause longer-lasting large-scale weather patterns, which could explain an increase in extreme events.“

Claim: Historical climate fluctuations in Central Europe overestimated due to tree ring analysis

by Postdam Institute, Sep 10, 2020 in WUWT


“Was there a warm period in the Middle Ages that at least comes close to today’s? Answers to such fundamental questions are largely sought from tree ring data,” explains lead author Josef Ludescher of the Potsdam Institute for Climate Impact Research (PIK). “Our study now shows that previous climate analyses from tree ring data significantly overestimate the climate’s persistence. A warm year is indeed followed by another warm rather than a cool year, but not as long and strongly as tree rings would initially suggest. If the persistence tendency is correctly taken into account, the current warming of Europe appears even more exceptional than previously assumed.”

To examine the quality of temperature series obtained from tree rings, Josef Ludescher and Hans Joachim Schellnhuber (PIK) as well as Armin Bunde (Justus-Liebig-University Giessen) and Ulf Büntgen (Cambridge University) focused on Central Europe. Main reason for this approach was the existing long observation series dating back to the middle of the 18th century to compare with the tree ring data. In addition, there are archives that accurately recorded the beginning of grape and grain harvests and even go back to the 14th century. These records, as well as the width of tree rings, allow temperature reconstructions. A warm summer is indicated by a wide tree ring and an early start of the harvest, a cold summer by a narrow tree ring and a late start of the harvest. The trees studied are those from altitudes where temperature has a strong influence on growth and where there is enough water for growth even in warm years.

“NEW LITTLE ICE AGE INSTEAD OF GLOBAL WARMING?” BY DR THEODOR LANDSCHEIDT

by Cap Allon, September 7, 2020 in Electroverse


Among the long list or scientific papers suggesting that a solar-driven spell of global cooling is on the cards, Dr Theodor Landscheidt’s ‘New Little ICE Age Instead of Global Warming?‘ probably has the claim of priority.

Published in 2003, just a year before his death, Landscheidt’s research is standing the test of time, and is still largely on course to be proved correct.

The paper’s abstract begins:

‘Analysis of the sun’s varying activity in the last two millennia indicates that contrary to the IPCC’s speculation about man-made global warming as high as 5.8C within the next hundred years, a long period of cool climate with its coldest phase around 2030 is to be expected.’

Crucially, in the growing list of research concluding that a solar-driven multidecadal spell of global cooling is on the cards (research from multiple studies of quite different characteristics), the year 2030 ALWAYS features prominently. Unlike the IPCC, which tosses its thermageddon doomsday date back and forth like a hot potato, researchers who track the multimillennial plays of the cosmos (namely those of the Sun) routinely land on the year 2030 as being the date of ‘climate deterioration’: this in itself should serve as compelling evidence.

Dr Landscheidt continues:

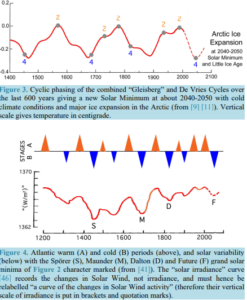
‘It is shown that minima in the 80 to 90-year Gleissberg cycle of solar activity, coinciding with periods of cool climate on Earth, are consistently linked to an 83-year cycle in the change of the rotary force driving the sun’s oscillatory motion … As the future course of this cycle and its amplitudes can be computed, it can be seen that the Gleissberg minimum around 2030 and another one around 2200 will be of the Maunder minimum type accompanied by severe cooling on Earth. This forecast should prove skillful as other long-range forecasts of climate phenomena, based on cycles in the sun’s orbital motion, have turned out correct as for instance the prediction of the last three El Niño years before the respective event.’

Dr Landscheidt concludes his introduction with the IPCC’s position on global warming, and he points to a growing list of publications showing a solar-climate connection:

PROF. NILS-AXEL MÖRNER: “THE APPROACHING GRAND SOLAR MINIMUM AND LITTLE ICE AGE CONDITIONS”

by Cap Allon, September 6, 2020 in Electroverse


Nils-Axel Mörner is the former head of the paleogeophysics and geodynamics department at Stockholm University. He retired in 2005 and since has dedicated his days to disproving the IPPC’s thermageddon nonsense while also warning of a coming Grand Solar Minimum.

Between 1997-2003, Mörner chaired an INTAS project on Geomagnetism & Climate; the project concluded that we, in the middle of the 21st century, had to be back in a new solar minimum with Little Ice Age climatic conditions.

These conclusions were quite straightforward, writes Mörner, and were included in a Special Issue of PRP: Obviously we are on our way into a new grand solar minimum. This sheds serious doubts on the issue of a continued, even accelerated, warming as proposed by the IPCC project. This quite innocent—and very true—conclusion made the publisher take the quite remarkable step to close down the entire scientific journal. This closing down gave rise to turbulence and objections within the scientific community. But it didn’t stop Mörner. He kept publishing scientific works regarding the impending GSM.

In 2015, Mörner’s “The Approaching New Grand Solar Minimum and Little Ice Age Climate Conditions” was published. It suggests that by 2030-2040 the Sun will experience a new grand solar minimum. This is evident from multiple studies of quite different characteristics, writes Mörner: the phasing of sunspot cycles, the cyclic observations of North Atlantic behavior over the past millennium, the cyclic pattern of cosmogenic radionuclides in natural terrestrial archives, the motions of the Sun with respect to the center of mass, the planetary spin-orbit coupling, the planetary conjunction history, and the general planetary-solar-terrestrial interaction.

During the previous grand solar minima—i.e. the Spörer Mini-mum (ca 1440-1460), the Maunder Minimum (ca 1687-1703) and the Dalton Minimum (ca 1809- 1821)—the climatic conditions deteriorated into Little Ice Age periods.

 …
see also  SEPTEMBER SNOW IS “A BIG DEAL FOR EVERYONE WHO FARMS” — WELCOME TO THE GRAND SOLAR MINIMUM

New Studies Suggests Sea Levels Are Lower Today Than They Were Even During The Little Ice Age

by K. Richard, June 18, 2020 in NoTricksZone


Coastal history analyses increasingly suggest sea levels are lower today than at any time in the last 7000 years – even lower than the 1600s to 1800s.

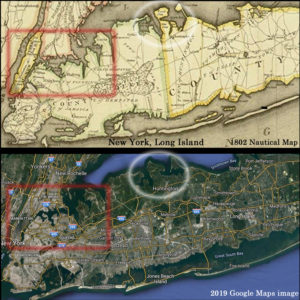
Recently we compared cartology from the 17th to 19th centuries to direct aerial images of coastal positions today. Rather surprisingly, there seemed to be more land area below sea level a few hundred years ago.

For example, an 1802 nautical map of New York City and Long Island shows there may have been more open waters in this region during the Little Ice Age than in 2019.


Image Source: Amazon.com

Shoreline analysis from India also suggests the coasts were further inland during the 1600s than they are today (Mörner, 2017).

CHILLING 1200-YEAR-OLD VIKING STONE WARNS OF FUTURE LITTLE ICE AGES

by Cap Allon, January 18, 2020 in Electroverse


A secret code unsolved for 1200 years has finally been cracked — the mysterious inscription on famed Viking relic the Rök stone (or Rökstenen) reveals the warrior nation feared the return of the deadly ‘Late Antique Little Ice Age’ which wiped out more than HALF of Scandinavia — the stone speaks of an enduring battle against extreme cold weather in the sixth century.

According to a study led by Per Holmberg, a professor of Swedish language at the University of Gothenburg, the text is telling a tale of light and darkness, warmth and cold, and it expresses a deep fear of a coming climate disaster.

“The main theme is apparently the Sun, or the rhythm of light”, Holmberg explained.

Of the nine riddles contained on the stone, five of them have the answer “the Sun.”


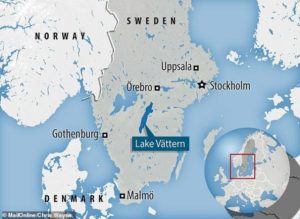
The stone was erected in the late 800s near the lake Vattern in south central Sweden.

Greenland Ice Core CO2 Concentrations Deserve Reconsideration

by Renee Hannon, January 7, 2020, in WUWT


Introduction
Ice cores datasets are important tools when reconstructing Earth’s paleoclimate. Antarctic ice core data are routinely used as proxies for past CO2 concentrations. This is because twenty years ago scientists theorized Greenland ice core CO2 data was unreliable since CO2trapped in air bubbles had potentially been altered by in-situ chemical reactions. As a result, Greenland CO2 datasets are not used in scientific studies to understand Northern and Southern hemispheres interactions and sensitivity of greenhouse gases under various climatic conditions.

This theory was put forward because Greenland CO2 data were more variable and different than Antarctic CO2 measurements located in the opposite polar region about 11,000 miles away. This article re-examines Greenland ice cores to see if they do indeed contain useful CO2 data. The theory of in-situ chemical reactions to explain a surplus and deficit of CO2, relative to Antarctic data, will be shown to be tenuous. The Greenland CO2 data demonstrates a response to the Medieval Warm Period, Little Ice Age, Dansgaard-Oeschger and other past climate change events. This response to past climate changes offers an improved explanation for why Greenland and Antarctic CO2 measurements differ. Further, Greenland CO2 measurements show rapid increases of 100 ppm during warm events in relatively short periods of time.

Atmospheric CO2 is More Variable in Northern Latitudes

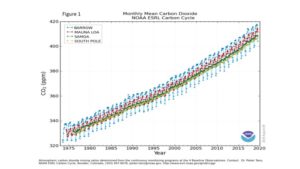
Figure 1, from NOAA, shows atmospheric CO2 concentrations measured from the continuous monitoring program at four key baseline stations spanning from the South Pole to Barrow, Alaska. CO2 has risen from about 330 ppm to over 400 ppm since 1975 and is increasing at approximately 1-2+ ppm/year. Many scientists believe that rapidly increasing CO2 is mostly due to fossil fuel emissions.

Figure 1. Atmospheric CO2 concentrations from NOAA

Three Graphs

by Kip Hansen, November 30, 2019 in WUWT


Now an annotated version of the second graph:

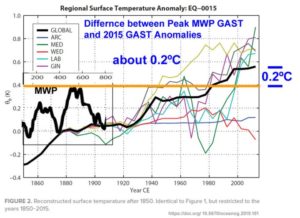
Here we have the second graph 1850-2015, with the global Average Surface Temperature anomaly (again — baseline 15 CE)  but I have dropped in a smaller window, on the left, bringing forward  the Roman Warm Period and the Medieval Warm Period (MWP) — the years 100-800 CE (same scale) — to illustrate the difference between the peak Global Average Surface Temperature (GAST)  of the Medieval Warm Period to the most current GAST on the graph (2015).

This exposes the ubiquitous trick of the Climate Debate, in which Global Temperatures are [almost] always shown only from the depths of the Little Ice Age (clearly marked on the first graph by Gebbie), resulting in images similar to Gebbie’s Figure 2 — despite the fact that most 2 millennia reconstructions clearly show the Roman and Medieval Warm Periods as generally in the same range as the Modern Warm Period.   Given the acknowledged range of error  in any temperature reconstruction and in modern estimates of global surface temperatures (today, in absolute temperatrures,  around +/- 0.5ºC  or a range of 1ºC)  — there may be little, if any,  significant-to-the-global-environment difference  between the two periods.

The Medieval Warm period did not result in a “Climate Catastrophe”  and the [iffy] little additional 0.2°C  seen today  is very unlikely to spark a modern Climate Catastrophe either.

L’Optimum Climatique Médiéval : ce Grand Oublié !

by A. Préat, 29 novembre 2019 in ScienceClimatEnergie


1/ Introduction

Comme rappelé dans un précédent article (ici) les événements hyperthermiques sont fréquents tout au long de l’histoire de la Terre. Bien que fréquents et étudiés avec détail, force est de reconnaître que le ‘fin’ mot de leur origine n’est toujours pas connu, sauf à leur attribuer à tous un lien de parenté avec l’un ou l’autre des gaz dits à effet de serre, sans qu’une démonstration en bonne et due forme soit présentée. C’est ce que décortique l’article paru dans SCE (ici) pour un des événements hyperthermiques les plus intenses (événement PETM pour Paleocene-Eocene Thermal Maximum) s’étant déroulé au début de l’ère Cénozoïque il y a environ 56 millions d’années.

Rappelons la succession de ces événements au Cénozoïque, d’abord l’événement PETM, ensuite E-O (Eocene-Oligocene transition with climatic shift), MMCO (Mid-Miocene Climatic Optimum), MPTO (Mid-Pliocene Thermal Optimum) et depuis environ 10 000 ans l’Optimum Holocène. Ces événements montrent tous que la Terre a régulièrement connu de longues périodes chaudes avec des ‘températures moyennes globales’ plus élevées que l’actuelle (voir par exemple Cronin 2010, également mentionné sur de nombreux sites web). L’indicateur climatique communément utilisé , la température moyenne globale est loin d’être parfait (ici et ici). Il ne faut donc pas prendre au pied de la lettre cette notion de ‘température moyenne globale’ car déjà pour aujourd’hui elle est plus que discutable, et pour le passé elle est plus qu’inconnue. Mais il n’en reste pas moins vrai que lors des événements hyperthermiques ou des optima climatiques la température était plus élevée qu’actuellement, nous le savons grâce à de nombreux indicateurs ou ‘proxies’ (voir plus loin). Ces événements ne concernent pas uniquement le Cénozoïque (y compris l’Holocène) mais l’ensemble de l’échelle des temps géologiques au-delà du Cénozoïque, avec parfois des températures fort supérieures à celles du Cénozoïque, comme par exemple au Permien (ici).

2/ L’Optimum Climatique Médieval

Revenons aux temps actuels, c’est-à-dire aux temps historiques. Plusieurs Optima Climatiques se succèdent depuis environ 6000 ans, avec pour la période la plus proche de nous, c’est-à-dire environ 3500 ans, la succession des Optima Climatiques Minoen, Romain, Médiéval et Actuel (Figure 1). Le plus récent est l’Optimum Climatique Médiéval (OCM) dont l’acmé se situe aux alentours de l’an mil. S’agissant de températures à peine plus élevées (1,5°C cfr ici et Le Roy Ladurie, 1967, également 1.0-1.4°C in Easterbrook, 2011), la délimitation précise de cet intervalle par rapport aux périodes encadrantes est difficile et l’OCM est finalement compris du 8ème au 13ème siècle (= le ‘petit optimum du Moyen Age’ d’environ 700 à 1350 sensu Le Roy Ladurie, 1967).

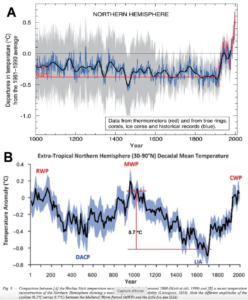
Figure 8 (cfr. Figure 5 in Préat, 2019). Capture d’écran de la Figure 8 de Scafetta (2019) : On the reliability of computer-based climate models. IJEGE, 19, 49-70. En comparant les deux courbes on peut se demander si l’on parle de la même chose! (RWP Roman Warm Period, DACP Dark Age Cold Period ou période froide post-romaine, MWP Medieval Warm Period, LIA Little Ice Age, CWP Current  Warm Period). Pour rappel la courbe A du haut, est la fameuse courbe en forme de hockey de Mann et al. 1998 du GIEC.

New Attempts To Erase The MWP & LIA

by P. Homewood, July 29, 2019 in NotaLotofPeopleKnowThat


There have been many attempts to get rid of the Medieval Warming Period and Little Ice Age, and here’s another one:

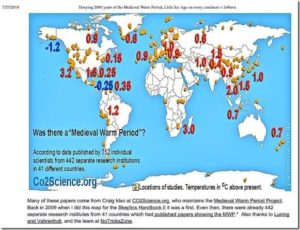
The science teams reconstructed the climate conditions that existed over the past 2,000 years using 700 proxy records of temperature changes, including tree rings, corals and lake sediments. They determined that none of these climate events occurred on a global scale.

https://www.bbc.co.uk/news/science-environment-49086783

As with the other failed attempts, this latest one claims that the MWP and LIA were only localised phenomena. But nothing could be further from the truth.

These three new studies rely on proxies, but time and again hockey stick studies based on proxies are proven to be fake, based on cherry picked proxies and dodgy statistics.

In fact, we have no need to rely on proxies, because the actual evidence of warm and cold periods is very real and substantial across the world.

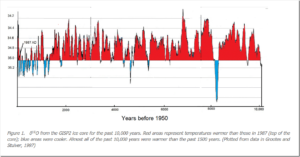
We are all familiar with the evidence from Greenland ice cores, which clearly show both the MWP and LIA:

http://www.kaltesonne.de/temperatures-over-the-past-10000-years/


Anti science L. A. Times hypes propaganda denying global wide Medieval Warm Period and Little Ice Age

by Larry Hamlin, July 28, 2019 in WUWT


The Los Angeles Times is at it again hyping anti science climate alarmist propaganda trying to conceal the global wide Medieval Warm Period and the Little Ice Age that are supported and justified by hundreds of scientific studies.

This climate alarmist propaganda Times article cites a new “study” that ridiculously attempts to deny these clearly established warm and cool periods in our past.

This alarmist hyped new “study” is addressed in a superb article at the JoNova website demonstrating the complete lack of scientific veracity of this studies claims.

There is nothing I can add to show how politically contrived and inane the claims are from this new “study” beyond the excellent presentation in the JoNova article.

Provided below are excerpts from this excellent article which demonstrate the lack of scientific credibility of the new “study” as well as the politically driven anti science climate alarmism bias of the Times.


The Little Ice Age: What Happened Around the World

by Marcia Wendorf, May 15, 2019 in InterestingEngineering


Between 1300 and 1850, the Earth experienced a Little Ice Age whose cause to this day is not known.

During the period 950 CE to 1250 CE, the earth experienced an unusually warm period, which became known as the Medieval Warm Period (MWP) or the Medieval Climatic Anomaly. At their height, temperatures during that period were similar to those experienced during earth’s mid-20th-century warming period.

Following the Medieval Warm Period came a period of intense cold, which has become known as the Little Ice Age (LIA). The term “Little Ice Age” was coined by Dutch-born American geologist F.E. Matthes in 1939. The LIA began around 1300 CE and lasted until about 1850 CE.

Within that stretch, NASA’s Earth Observatory has described three particularly cold periods: one around 1650, a second around 1770, and the third around 1850.

The Little Ice Age – Back to the Future

by Jim Steele, April 4, 2019 in WUWT


Extreme scientists and politicians warn we will suffer catastrophic climate change if the earth’s average temperature rises 2.7°F above the Little Ice Age average. They claim we are in a climate crisis because average temperature has already warmed by 1.5°F since 1850 AD. Guided by climate fear, politicians fund whacky engineering schemes to shade the earth with mirrors or aerosols to lower temperatures. But the cooler Little Ice Age endured a much more disastrous climate.

The Little Ice Age coincides with the pre-industrial period. The Little Ice Age spanned a period from 1300 AD to 1850 AD, but the exact timing varies. It was a time of great droughts, retreating tree lines, and agricultural failures leading to massive global famines and rampant epidemics. Meanwhile advancing glaciers demolished European villages and farms and extensive sea ice blocked harbors and prevented trade.

Planet-Sized Experiments – we’ve already done the 2°C test

by Willis Eschenbach, March 17, 2019 inWUWT


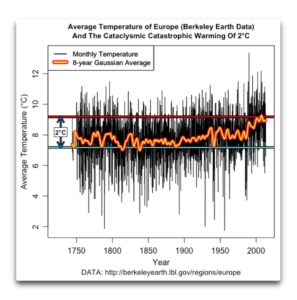
People often say that we’re heading into the unknown with regards to CO2 and the planet. They say we can’t know, for example, what a 2°C warming will do because we can’t do the experiment. This is seen as important because for unknown reasons, people have battened on to “2°C” as being the scary temperature rise that we’re told we have to avoid at all costs.

But actually, as it turns out, we have already done the experiment. Below I show the Berkeley Earth average surface temperature record for Europe. Europe is a good location to analyze, because some of the longest continuous temperature records are from Europe. In addition, there are a lot of stations in Europe that have been taking record for a long time. This gives us lots of good data.

So without further ado, here’s the record of the average European temperature.