Archives par mot-clé : Global Warming

Climate scientists officially declare ‘climate emergency’ at an end

by ClintelGroup, Nov 20, 2024 in WUWT


The Chamber of Deputies in session

Climate scientists have issued a shock declaration that the “climate emergency” is over.

A two-day climate conference in Prague, organised by the Czech division of the international Climate Intelligence Group (Clintel), which took place on November 12-13 in the Chamber of Deputies of the Czech Republic in Prague, “declares and affirms that the imagined and imaginary ‘climate emergency’ is at an end”.

The communiqué, drafted by the eminent scientists and researchers who spoke at the conference, makes clear that for several decades climate scientists have  systematically exaggerated the influence of CO2 on global temperature.

The high-level scientific conference also declared:

“The Intergovernmental Panel on Climate Change, which excludes participants and published papers disagreeing with its narrative, fails to comply with its own error-reporting protocol and draws conclusions some of which are dishonest, should be forthwith dismantled.”

The declaration supports the conclusions of the major Clintel report The Frozen Climate Views of the IPCC [presented to the Conference by Marcel Crok, Clintel’s co-founder].

Moreover, the scientists at the conference declared that even if all nations moved straight to net zero emissions, by the 2050 target date the world would be only about 0.1 C cooler than with no emissions reduction.

So far, the attempts to mitigate climate change by international agreements such as the Paris Agreement have made no difference to our influence on climate, since nations such as Russia and China, India and Pakistan continue greatly to expand their combustion of coal, oil and gas.

The cost of achieving that 0.1 C reduction in global warming would be $2 quadrillion, equivalent to 20 years’ worldwide gross domestic product.

Finally, the conference “calls upon the entire scientific community to cease and desist from its persecution of scientists and researchers who disagree with the current official narrative on climate change and instead to encourage once again the long and noble tradition of free, open and uncensored scientific research, investigation, publication and discussion”.

The full text of the communiqué follows:

The International Scientific Conference of the Climate Intelligence Group (Clintel), in the Chamber of Deputies of the Czech Republic in Prague assembled on the Twelfth and Thirteenth Days of November 2024, has resolved and now declares as follows, that is to say –

  1. The modest increase in the atmospheric concentration of carbon dioxide that has taken place since the end of the Little Ice Age has been net-beneficial to humanity.
  2. Foreseeable future increases in greenhouse gases in the air will probably also prove net-beneficial.
  3. The rate and amplitude of global warming have been and will continue to be appreciably less than climate scientists

Continuer la lecture de Climate scientists officially declare ‘climate emergency’ at an end

Man Made Global Warming

by P. Homewood, Apr 14, 2024 in NotaLotOfPeopleKnowThat


image

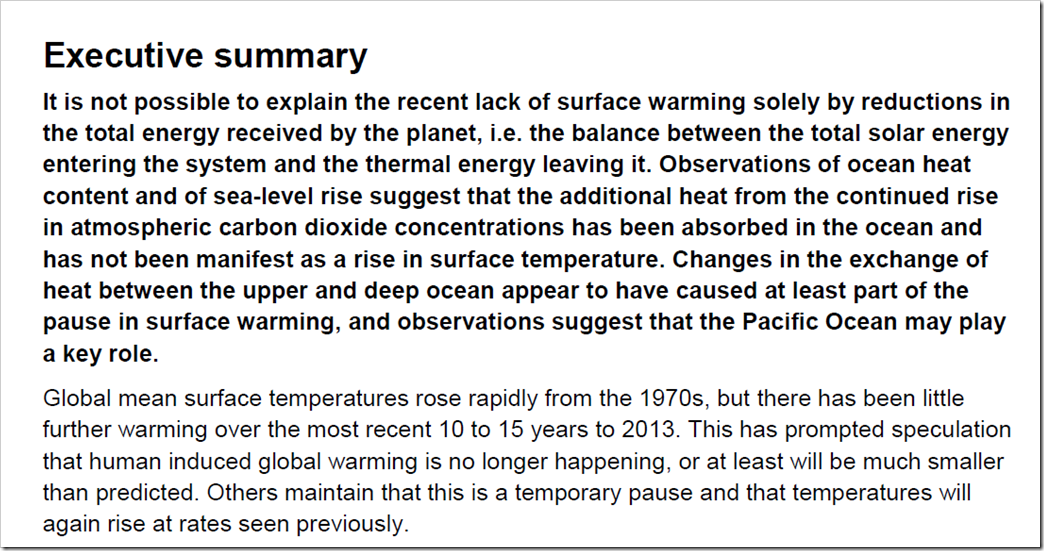
http://web.archive.org/web/20130927101652/https://www.metoffice.gov.uk/media/pdf/q/0/Paper2_recent_pause_in_global_warming.PDF

Once upon a time there was The Pause.

For a decade and a half, global temperatures stopped rising, an embarrassment for climate scientists. Even the Met Office published a long study in 2013 into the possible reasons.

But while one team at the Met Office were scratching their heads, another was busy at work eliminating the problem.

After all, if the data does not support the theory, you simply change the data.

The Met Office’s Hadley Centre, in conjunction with the disgraced Climate Research Unit at the UEA, had for years published their global temperature series known as HADCRUT3. They regarded it as the gold standard of datasets.

But just a year after the Met Office’s paper on the pause, a new version was rushed out, HADCRUT4, which conveniently removed that pause.

By 2014, when HADCRUT3 was formally replaced, the new version had added about a tenth of a degree to warming since 2000.

Meteorologist Debunks TIME Mag’s Claim That Jan 2024 Was Hottest On Record

by A. Watts, Feb 19, 2024 in ClimateChangeDispatch


An article in TIME Magazine (TIME) claims that January 2024 was the hottest ever on record for the planet. Titled, 2024 Had the Hottest January on Record Following 2023’s Hottest Year on Record the article is based on a single source of temperature data.

Data from multiple other sources of temperature measurements refute this claim. [emphasis, links added]

TIME refers to the Copernicus EU climate service as the source for its alarming claim. Copernicus EU issued a press release claiming:

January 2024 was the warmest January on record globally, with an average ERA5 surface air temperature of 13.14°C, 0.70°C above the 1991-2020 average for January and 0.12°C above the temperature of the previous warmest January, in 2020.

The month was 1.66°C warmer than an estimate of the January average for 1850-1900, the designated pre-industrial reference period.

The problem with that is that they are using a reference period of 1850 to 1900 that no other climate data source uses; a period, not coincidentally, more than 100 years of global warming ago when the Earth was cooler than today.

For example, NASA Goddard Institute for Space Studies (GISS) produced a map of the globe that shows a significantly lower global temperature for January 2024.

The GISS global value was just 1.20°C compared to the 1.66°C claimed by Copernicus is different because NASA GISS is using a base period of 1951 to 1980.

Copernicus seemingly cherry-picked the reference period to fit the climate crisis narrative, and TIME was too uninterested in seeking and presenting the truth to investigate the extraordinary claim, instead reporting it as an unchallenged fact.

To what extent are temperature levels changing due to greenhouse gas emissions?

by J.K. Dagsvik & S.H. Moen,  Nov  2023 in  StatisticsNorway


Abstract

Weather and temperatures vary in ways that are difficult to explain and predict precisely. In this article we review data on temperature variations in the past as well possible reasons for thesevariations. Subsequently, we review key properties of global climate models and statistical analyses conducted by others on the ability of the global climate models to track historical temperatures.

These tests show that standard climate models are rejected by time series data on global temperatures. Finally, we update and extend previous statistical analysis of temperature data
(Dagsvik et al., 2020). Using theoretical arguments and statistical tests we find, as in Dagsvik et al.(2020), that the effect of man-made CO2 emissions does not appear to be strong enough to cause systematic changes in the temperature fluctuations during the last 200 years.

Keywords: Global climate models, Climate change, Temperature analysis, Fractional Gaussian noise,
Long-range dependence

The Earth Is Mildly Warming, But Is CO2 The Cause?

by H.W. Jenkins, Nov 6, 2023 in ClimateChangeDispatch


If this column has ever plagiarized itself, it’s by repeating the phrase “evidence of warming is not evidence of what causes warming.”

A paper published by the Norwegian government’s statistical agency, written by two of its retired experts, touching on this very subject has called forth so many shrieked accusations of climate apostasy that you know it must be interesting.

The authors ask a simple question: Are computerized climate simulations a sufficient basis for attributing observed warming to human CO2? [emphasis, links added]

After all, the Earth’s climate has been subject to substantial warming and cooling trends for millenniathat remain unexplained and can’t be attributed to fossil fuels.

As statisticians, their conclusion: “With the current level of knowledge, it seems impossible to determine how much of the temperature increase is due to emissions of CO2.

Wow. For all the abuse dumped on them for this modest observation, and even some apologetic hemming and hawing from the government-run Statistics Norway, the authors don’t say climate models don’t make useful predictions.

Their predictions are useful precisely for testing the validity of climate models. What’s more, many concerned about climate change have no trouble seeing the problem as a matter of risks rather than certainties.

This includes coauthor John Dagsvik, who told Norway’s Aftenposten newspaper he favors emissions curbs for precautionary reasons.

The correlation-to-causation puzzle is hardly the authors’ invention, having bedeviled the oracular Intergovernmental Panel on Climate Change (IPCC) since its founding in 1988.

But unrestrained name-calling is required, the critics say, because anything that undermines confidence in climate models undermines progress against climate change.

Earth’s Greenhouse Effect Has Not Been Enhanced, But Instead Its Impact Has Declined Since 1983

by K. Richard, April 10, 2023 in NoTricksZone


In the satellite era scientists have continued to observe the Earth’s total greenhouse effect (which includes effects from greenhouse gases and clouds) exerting an overall negative impact (cooling) on surface temperatures since the 1980s. This rules out both CO2 and an enhanced greenhouse effect as drivers of global warming.

Earth’s total greenhouse effect impact on climate is realized by the sum of all contributors to it: water vapor, clouds, and the “anthropogenic” greenhouse gases CO2 and CH4.

Given the modern assumption that humans are responsible for global warming due especially to our CO2 and CH4 emissions, it stands to reason that Earth’s downwelling longwave (LWdn) should be increasing and thus the Earth’s greenhouse effect should be enhanced due to the rising greenhouse gases emissions.

But, as Cess and Udelhofen (2003) reported 20 years ago, Earth’s greenhouse effect has not been enhanced in recent decades. Instead, it has been in a state of decline since the 1980s.

“[T]he negative trend in G [greenhouse effect] indicates that the atmospheric greenhouse effect is temporarily [1985-1999] decreasing despite the fact that greenhouse gasses are increasing.”

The Global Warming Doomsday Religion Is A Suicide Pact To Wreck Our Economy

by W. Crockett, Mar 14, 2023 in ClimateChangeDispatch


There is no scientific evidence that the minuscule 0.01% increase in atmospheric carbon dioxide (CO2) since 1780 has had any effect on the Earth’s average temperature.

Nonetheless, in the 1980s, a religious/political movement against man-made or anthropogenic CO2 arose.

It was driven by catastrophic predictions from a gaggle of impenetrable and undecipherable computer climate models operated by the International Panel on Climate Change (IPCC) and quickly metastasized into a worldwide mass movement with all the fervor of a new evangelical religion.

Composition of the Atmosphere: The tropospheric atmosphere is composed of 78% nitrogen, 21% oxygen, 1% argon, 0.4 to 4% water vapor, and several trace gases.

The largest trace gas is carbon dioxide at 0.041%, followed by methane at 0.0018%, and nitrous oxide at 0.0003%. The volume of atmospheric molecules is also expressed in terms of parts per million (ppm): nitrogen 780,000 ppm, oxygen 210,000 ppm, and argon 10,000 ppm.

Scientists have also speculated that water vapor constitutes something between 4,000 and 40,000 ppm, depending on time and location. By contrast, the trace gas CO2 has only 410 molecules per million (.041%); methane (CH4) has only a minuscule 1.8 molecules per million; and nitrous oxide (N2O) is only a barely detectable 1/3 molecule per million.

All atmospheric molecules create a blanket of heat that slows the loss of infrared radiation to space. The sun’s short-wave radiation passes through the troposphere generally unimpeded by nitrogen, oxygen, and argon molecules to the surface, which increases the kinetic motion (heat) of all impacted surface and atmospheric molecules.1

The increased molecular motion, in turn, increases full spectrum (blackbody) infrared radiation (IR) in all directions. All atmospheric molecules, including water vapor and CO2, take up the additional heat by conduction (contact), from both the surface and surrounding atmospheric molecules.

The Global Warming Doomsday Religion Is A Suicide Pact To Wreck Our Economy

by D.W. Crockett, Mar 14, 2023 in ClimateChangeDispatch


There is no scientific evidence that the minuscule 0.01% increase in atmospheric carbon dioxide (CO2) since 1780 has had any effect on the Earth’s average temperature.

Nonetheless, in the 1980s, a religious/political movement against man-made or anthropogenic CO2 arose.

It was driven by catastrophic predictions from a gaggle of impenetrable and undecipherable computer climate models operated by the International Panel on Climate Change (IPCC) and quickly metastasized into a worldwide mass movement with all the fervor of a new evangelical religion.

As Eric Hoffer observes in his book, The True Believer, “Mass movements can rise and spread without belief in God, but never without belief in a devil.”

In this new “doomsday” mass movement, millions of people truly believe that man-made CO2 is a modern-day devil that will cause glaciers to melt, seas to rise, and coastlines to submerge. They also believe that mankind can, and must, save the planet from this catastrophe by reducing emissions of the devil CO2 to net zero.

Those who don’t believe are labeled “climate deniers,” a derogatory reference to those who deny that the Nazis perpetrated the Holocaust.

Unfortunately, most politicians in the U.S., Canada, and Europe, as well as the press and heads of many large corporations have blindly joined this Anthropogenic Global Warming (AGW) religion to stamp out the CO2 devil.

..

….

New Study: Greenhouse Gases May Not Be Causing 21st-Century Warming

by D. Whitehouse, Dec 16, 2022 in ClimateChangeDispatch


A new study by a team of leading climate scientists suggests that the effect of carbon dioxide this century might be small if not undetectable when compared to natural climate variability.

Global surface temperature is and always has been the key climate parameter. Whatever is happening to the Earth’s climate balance, it must, sooner or later, be reflected in the global annual average temperature, and not just in regional variations. [emphasis, links added]

But therein lies what is to some an inconvenience as the changes in the global temperature this century are open to differing interpretations including the suggestion that increases in anthropogenic greenhouse gas emissions are not needed to explain the changes we have seen in the last 20 years or so.

It’s a conclusion that many would dismiss as coming from climate “skeptics,” or downright deniers.

But what if it’s the view of scientists from two of the world’s leading institutes researching climate change; the University of Oxford and the US National Center for Atmospheric Research? Then it must be taken seriously and not dismissed offhand.

It is important research because it is the trend in the increase of global temperature caused by anthropogenic [human-caused] greenhouse gas emissions that is the most important variable for policymakers considering the scale and timescale of action in the coming decades.

However, this vital parameter is uncertain because recent decades have shown that we are living through a period of considerable natural climate variability.

Thus, a new study published in the Journal of Climate suggests the effect of carbon dioxide this century might be small if not undetectable when compared to natural climate variability.

The researchers contend that recent temperature trends might indicate that there is no detectable increase in global temperature due to greenhouse gas emissions.

While this suggestion is interesting it must be said that the researchers get themselves in a muddle when estimating temperature trends this century.

On the one hand, they acknowledge the existence of the global temperature hiatus between 2000 – 2014, but on the other hand, they do not properly distinguish the effects of the natural El Nino eventsthat have taken place in the past seven years.

This is why they conclude there might have been an acceleration in global temperature increase over this period.

They say that most of the increase is not due to greenhouse gases but to aerosol emission reductions.

The combustion of fossil fuels releases greenhouse gases but it also causes pollution that cools the Earth,offsetting any warming.

This is good news for public health as airborne particles kill several million people a year, but it also accelerates global warming.

They assess that aerosol emissions have contributed to an increase in the rate of anthropogenic warming since 2000 although they have large uncertainty.

When considering estimates of the amount of warming due to aerosol reduction along with natural climate variability, they find a solution with all the post-2000 temperature trends being due to natural variability alone.

They say (p 4283) it’s a credible hypothesis that global temperature changes since 2000 could be “arising largely from internal variability.”

Read more at NZW

Also here

Now It’s Claimed Anthropogenic Global Warming Is Driven By Aerosol Emissions Reductions, Not CO2

by K. Richard, Nov 10, 2022 in NoTricksZone


An increase in effective radiative forcing from human activity is now said to be mostly driven by a decline in aerosol pollution, superseding the effects of CO2 emissions.

The majority of an alleged acceleration in anthropogenic global warming in the 21st century “is driven by changes in the the aerosol [effective radiative forcing] trend, due to aerosol emissions reductions” (Jenkins et al., 2022).

Abstract

Estimates of the anthropogenic effective radiative forcing (ERF) trend have increased by 50% since 2000 (+0.4W/m2/decade in 2000-2009 to +0.6W/m2/decade in 2010-2019), the majority of which is driven by changes in the aerosol ERF trend, due to aerosol emissions reductions. Here we study the extent to which observations of the climate system agree with these ERF assumptions. We use a large ERF ensemble from IPCC’s Sixth Assessment Report (AR6) to attribute the anthropogenic contributions to global mean surface temperature (GMST), top-of-atmosphere radiative flux, and aerosol optical depth observations. The GMST trend has increased from +0.18°C/decade in 2000-2009 to +0.35°C/decade in 2010-2019, coinciding with the anthropogenic warming trend rising from +0.19°C/decade in 2000-2009 to +0.24°C/decade in 2010-2019. This, and observed trends in top-of-atmosphere radiative fluxes and aerosol optical depths support the claim of an aerosol-induced temporary acceleration in the rate of warming. However, all three observation datasets additionally suggest smaller aerosol ERF trend changes are compatible with observations since 2000, since radiative flux and GMST trends are significantly influenced by internal variability over this period. A zero-trend-change aerosol ERF scenario results in a much smaller anthropogenic warming acceleration since 2000, but is poorly represented in AR6’s ERF ensemble. Short-term ERF trends are difficult to verify using observations, so caution is required in predictions or policy judgments that depend on them, such as estimates of current anthropogenic warming trend, and the time remaining to, or the outstanding carbon budget consistent with, 1.5°C warming. Further systematic research focused on quantifying trends and early identification of acceleration or deceleration is required.

New Research: Eastern U.S. Warming Over Last 50 Years Overstated By 50%

by C. Morrison, Nov 24, 2022 in ClimateChangeDispatch


The widespread use of regularly adjusted global and local surface temperature datasets showing increasingly implausible rates of warming has been dealt a further blow with new groundbreaking research that shows 50% less warming over 50 years across the eastern United States.

The research attempts to remove distortions caused by increasing urban heat and uses human-made structure density data over 50 years supplied by the Landsat satellites. [bold, links added]

The 50% reduction in the warming trend is in comparison with the official National Oceanic and Atmospheric Administration (NOAA) homogenized surface temperature dataset.

The research was compiled by two atmospheric scientists at the University of Alabama in Huntsville, Dr. Roy Spencer and Professor John Christy.

They used a dataset of urbanization changes called ‘Built-Up’ to determine the average effect that urbanization has had on surface temperatures.

Urbanization differences were compared to temperature differences from closely spaced weather stations. The temperature plotted was in the morning during the summertime.

A full methodology of the project is shown here in a posting on Dr. Spencer’s blog.

Dr. Spencer believes that the ‘Built-Up’ dataset, which extends back to the 1970s, will be useful in ‘de-urbanizing’ land-based surface temperature measurements in the U.S. as well as other countries.

All the major global datasets use temperature measurements from the Integrated Surface Database (ISD), and all have undertaken retrospective upward adjustments in the recent past.

In the U.K., the Met Office removed a ‘pause’ in global temperatures from 1998 to around 2010 by two significant adjustments to its HadCRUT database over the last 10 years.

The adjustments added about 30% warming to the recent record. Removing the recent adjustments would bring the surface datasets more in line with the accurate measurements made by satellites and meteorological balloons.

Of course, if the objective is to promote a command-and-control Net Zero project using widespread fear of rising temperatures to mandate huge societal and economic changes, a little extra warming would appear useful.

But warming on a global scale started to run out of steam over 20 years ago, and the stunt can only be pulled for so long before the disconnect with reality becomes too obvious.

There is a danger that the integrity of the surface measurements will be put on the line. Earlier this year, two top atmospheric scientists, Emeritus Professors William Happer and Richard Lindzen told a U.S. Government inquiry that “climate science is awash with manipulated data, which provides no reliable scientific evidence.

50-Year U.S. Summer Temperature Trends: ALL 36 Climate Models Are Too Warm

by Dr Roy Spencer, Oct 20, 2022 in GloablWarming


I’ll get right to the results, which are pretty straightforward.

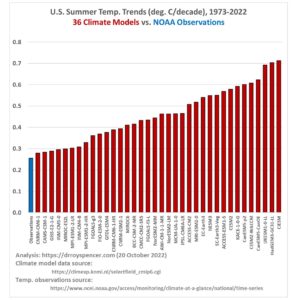
As seen in the accompanying plot, 50-year (1973-2022) summer (June/July/August) temperature trends for the contiguous 48 U.S. states from 36 CMIP-6 climate model experiments average nearly twice the warming rate as observed by the NOAA climate division dataset.


The 36 models are those catalogued at the KNMI Climate Explorer website, using Tas (surface air temperature), one member per model, for the ssp245 radiative forcing scenario. (The website says there are 40 models, but I found that four of the models have double entries). The surface temperature observations come from NOAA/NCEI.

The official NOAA observations produce a 50-year summer temperature trend of +0.26 C/decade for the U.S., while the model trends range from +0.28 to +0.71 C/decade.

As a check on the observations, I took the 18 UTC daily measurements from 497 ASOS and AWOS stations in the Global Hourly Integrated Surface Database (mostly independent from the official homogenized NOAA data) and computed similar trends for each station separately. I then took the median of all reported trends from within each of the 48 states, and did a 48-state area-weighted temperature trend from those 48 median values, after which I also got +0.26 C/decade. (Note that this could be an overestimate if increasing urban heat island effects have spuriously influenced trends over the last 50 years, and I have not made any adjustment for that).

The importance of this finding should be obvious: Given that U.S. energy policy depends upon the predictions from these models, their tendency to produce too much warming (and likely also warming-associated climate change) should be factored into energy policy planning. I doubt that it is, given the climate change exaggerations routinely promoted by environment groups, anti-oil advocates, the media, politicians, and most government agencies

Does this explode the great global warming myth?

by P. Homewood, Sep 21, 20022 in NotaLotofPeopleKnowThat


THE ‘greenhouse effect’ has been with us for so long that it is taken as ‘settled’ science in most quarters. However, as a new paper shows, there is much still to debate.

The author, William Kininmonth, is no bedroom blogger. As a former head of Australia’s National Climate Centre, he deserves careful and respectful attention.

Kininmonth’s suggestion is that the approach of the UN’s  Intergovernmental Panel on Climate Change (IPCC), based on a concept of radiation forcing at the top of the atmosphere, is logically unsound and ignores important details about what happens at the Earth’s surface. In particular, he notes that there are huge flows of energy – vastly bigger than the effect of greenhouse gases – from the warm tropical oceans to the atmosphere, whence it is transported poleward by the winds, warming the northern latitudes.

Read the full story here.

Scientists: Only 10% Of The 1984-2017 Greenhouse Gas (Longwave) Forcing Was From CO2

by K. Richard, Aug 25, 2022 in NoTricksZone


A late 2021 study finds water vapor and temperature changes accounted for 90% of the changes in clear-sky downwelling longwave or greenhouse effect forcing since the mid-1980s. CO2 forcing assumed a mere bit-player role.

The seminal Feldman et al. (2015) study concluded it takes 10 years and a 22 ppm increase in CO2 to account for just one-tenth of the total longwave or greenhouse effect forcing in recent (2000-2010) climate change trends. The remaining longwave forcing contribution is from water vapor and clouds.


Tim Ball: The Evidence Proves That CO2 is Not a Greenhouse Gas

by T. Ball, Sept 13, 2018 in Technocracy


The Intergovernmental Panel on Climate Change (IPCC) claim of human-caused global warming (AGW) is built on the assumption that an increase in atmospheric CO2 causes an increase in global temperature. The IPCC claim is what science calls a theory, a hypothesis, or in simple English, a speculation.  Every theory is based on a set of assumptions. The standard scientific method is to challenge the theory by trying to disprove it. Karl Popper wrote about this approach in a 1963 article, Science as Falsification. Douglas Yates said,

“No scientific theory achieves public acceptance until it has been thoroughly discredited.”

Thomas Huxley made a similar observation.

“The improver of natural knowledge absolutely refuses to acknowledge authority, as such. For him, skepticism is the highest of duties; blind faith the one unpardonable sin.”

In other words, all scientists must be skeptics, which makes a mockery out of the charge that those who questioned AGW, were global warming skeptics. Michael Shermer provides a likely explanation for the effectiveness of the charge.

“Scientists are skeptics. It’s unfortunate that the word ‘skeptic’ has taken on other connotations in the culture involving nihilism and cynicism. Really, in its pure and original meaning, it’s just thoughtful inquiry.”

The scientific method was not used with the AGW theory. In fact, the exact opposite occurred, they tried to prove the theory. It is a treadmill guaranteed to make you misread, misrepresent, misuse and selectively choose data and evidence. This is precisely what the IPCC did and continued to do.

A theory is used to produce results. The results are not wrong, they are only as right as the assumptions on which they are based. For example, Einstein used his theory of relativity to produce the most famous formula in the world; e = mc2. You cannot prove it wrong mathematically because it is the end product of the assumptions he made. To test it and disprove it, you challenge one or all of the assumptions. One of these is represented by the letter “c” in the formula, which assumes nothing can travel faster than the speed of light. Scientists challenging the theory are looking for something moving faster than the speed of light.

Global Warming Has Stalled Over Much Of The Last 10 Years, Arctic Never Melted Away

by P. Gosselin, July, 22, 2022 in NoTrickZone


The globe hasn’t been warming and the Arctic hasn’t been melting much for almost a decade now.

Recall the climate crisis loonies warned us some 20 years ago the Arctic sea ice would disappear by the summer of 2014. Well it’s still very much there, as Joe Bastardi reminds us at his most recent Saturday Summary:

No warming in 8 years

Moreover, UAH global mean temperature anomaly hasn’t risen in eight years as well, Hat-tip Snowfan here:

….

Global-Scale Warming Events Of ‘Up To 15 °C Within A Few Decades’ Have Occurred Since The Jurassic

Boulila et al., 2022 in NoTricksZone


A new study (Boulila et al., 2022) suggests “abrupt and severe changes in Earth’s past climate” have been occurring at ~1,500-year periodicities since the iceless Jurassic period.

Warming events of degrees C per within decades or less were at one time thought to have occurred only at locations like Greenland and the North Atlantic during the last glacial period (70 to 12 thousand years ago).

But the evidence has been piling up from locations throughout the globe (e.g., on continents and tropical to high latitude oceans, lakes, and rivers) indicating these warming events have “a global interconnection between the two hemispheres.”

These “abrupt and severe” global warming events with ~1,500-year periodicities can even be traced back to the iceless Jurassic period when Antarctica was a rainforest and 38°C warmer than today. This suggests the driving force for these global warming periods were not dependent on ice sheet dynamics.


Abstract

Earth’s past climate exhibits short-term (1500-year) pronounced fluctuations during the last glacial period, called Dansgaard–Oeschger (DO) glacial events, which have never been detected in pre-Quaternary times. The record of DO equivalent climate variability in Mesozoic strata can provide constraints on understanding these events. Here we highlight a prominent 1500-year cyclicity in a Jurassic (~ 155 Ma) ice-free sedimentary record from the Tethyan Basin. This Jurassic 1500-year cyclicity is encoded in high-resolution magnetic susceptibility (MS) proxy data reflecting detrital variations, and expressed as marl-limestone couplets. Additionally, MS data detect the modulation of these DO-scale couplets by supercouplet sets, reflecting the precession and its harmonics. We suggest that this Jurassic DO-like cyclicity may originate from paleo-monsoon-like system, analogous to the record of DO events in the Pleistocene East Asian monsoon archives. Paleogeographic reconstructions and atmosphere–ocean simulations further support the potential existence of strong, ancient monsoon circulations in the Tethyan Basin during the Jurassic.

Rapid Asia–Europe–North America geographic dispersal of earliest Eocene primate Teilhardina during the Paleocene–Eocene Thermal Maximum

by T. Smith et al., July 25, 2022 in PNAS


Abstract

True primates appeared suddenly on all three northern continents during the 100,000-yr-duration Paleocene–Eocene Thermal Maximum at the beginning of the Eocene, ≈55.5 mya. The simultaneous or nearly simultaneous appearance of euprimates on northern continents has been difficult to understand because the source area, immediate ancestors, and dispersal routes were all unknown. Now, omomyid haplorhine Teilhardinais known on all three continents in association with the carbon isotope excursion marking the Paleocene–Eocene Thermal Maximum. Relative position within the carbon isotope excursion indicates that Asian Teilhardina asiatica is oldest, European Teilhardina belgicais younger, and North American Teilhardina brandti and Teilhardina americana are, successively, youngest. Analysis of morphological characteristics of all four species supports an Asian origin and a westward Asia-to-Europe-to-North America dispersal for Teilhardina. High-resolution isotope stratigraphy indicates that this dispersal happened in an interval of ≈25,000 yr. Rapid geographic dispersal and morphological character evolution in Teilhardina reported here are consistent with rates observed in other contexts.

New Study: The CO2-Drives-Global-Warming ‘Concept’ Is ‘Obsolete And Incorrect’

by Lightfoot & Ratzer,  Mar 14, 2022 in NoTricksZone/JBasicApplSci


In analyzing UAH global temperature and Mauna Loa CO2 records from 1979 to 2021, climate researchers Lightfoot and Ratzer (2022) report there has been “little, if any” correlation between these two variables during this period.

They assert that between 91 and 98% of Earth’s greenhouse gas effect is from water vapor, as CO2 and other trace gases contribute less than 5% to greenhouse gas forcing.

A solar minimum has just began in the current solar cycle 25. The declining solar output is projected to eventually lead to a ~1 to 1.2°C cooling over the next 30 to 40 years. Solar minimum periods are also accompanied by crop failures due to frost and weather extremes delivering excessive heat.

The authors conclude by suggesting the popularized conceptualization of CO2 as a driver of global warming has proven to be “obsolete and incorrect”.

Northern and Southern Hemisphere Warming

by A. May, Mar 18, 2022 in WUWT


As shown in Figure 1, the Hadley Climatic Research Unit HadCRUT5 temperature dataset suggests the Northern Hemisphere warmed 0.74°C (1.3° F) more than the Southern Hemisphere from 1979 through 2021. The UAH satellite temperature lower troposphere record is directionally similar but the difference between the hemispheres is much less, as shown in Figure 2. Both figures have identical vertical scales of 1.4°C. The UAH global satellite warming difference, from 1979 to 2021, between the hemispheres is about 0.2°C (0.4° F), less by more than a factor of 3.

Conclusions

The UAH and HadCRUT5 records both show the Northern Hemisphere warming more rapidly than the Southern, but the amount of extra warming in the HadCRUT5 record is anomalous. While the Southern Hemisphere satellite and surface rates are similar, the Northern Hemisphere rates are very different.

The global UAH lower troposphere and HadSST4 warming rates are both 0.14°C/decade from 1979 to 2020, the same to two decimals, as shown in my previous post. The oceans cover 70% of Earth’s surface and the HadSST4 dataset is used in combination with the CRUTEM5 land-surface temperature record to produce the curves in Figure 1. Given this, the large difference in Northern Hemisphere warming rates between Figures 1 and 2 is very hard to explain. Frankly, it suggests there is a problem with CRUTEM5. Figure 3 suggests the problem is getting worse in recent years, not better. This topic is discussed in more detail in my latest book: The Great Climate Change Debate: Karoly v Happer.

World Atmospheric CO2, Its 14C Specific Activity, Non-fossil Component, Anthropogenic Fossil Component, and Emissions (1750–2018

by Kenneth et al. 2022, Feb 2022 in HealthPhysics


Abstract

After 1750 and the onset of the industrial revolution, the anthropogenic fossil component and the non-fossil component in the total atmospheric CO2 concentration, C(t), began to increase. Despite the lack of knowledge of these two components, claims that all or most of the increase in C(t)since 1800 has been due to the anthropogenic fossil component have continued since they began in 1960 with “Keeling Curve: Increase in CO2from burning fossil fuel.” Data and plots of annual anthropogenic fossil CO2 emissions and concentrations, C(t), published by the Energy Information Administration, are expanded in this paper. Additions include annual mean values in 1750 through 2018 of the 14C specific activity, concentrations of the two components, and their changes from values in 1750. The specific activity of 14C in the atmosphere gets reduced by a dilution effect when fossil CO2, which is devoid of 14C, enters the atmosphere. We have used the results of this effect to quantify the two components. All results covering the period from 1750 through 2018 are listed in a table and plotted in figures. These results negate claims that the increase in C(t) since 1800 has been dominated by the increase of the anthropogenic fossil component. We determined that in 2018, atmospheric anthropogenic fossil CO2 represented 23% of the total emissions since 1750 with the remaining 77% in the exchange reservoirs. Our results show that the percentage of the total CO2 due to the use of fossil fuels from 1750 to 2018 increased from 0% in 1750 to 12% in 2018, much too low to be the cause of global warming.

New Research: “CO2 Influence On Global Temperature Development Since1860 Only Half As Large As IPCC Estimate!

by  F. Vahrenholt, Dec 14, 2021 in NoTricksZone


On November 3, 2021, the renowned scientific journal Climate published a paper on solar influence on climate.

The paper by the renowned solar researcher Dr. Frank Stefani from the Helmholtz Zentrum Dresden-Rossendorf is entitled: “Solar and Anthropogenic Influences on Climate: A Regression Analysis and Tentative Predictions” and concludes that the influence of CO2 on the development of global temperatures from 1860 until today was only about half as large as the last report of the Intergovernmental Panel on Climate Change (IPCC) assumed.

As a reminder, the IPCC concludes that 98% of the warming ( 1.07 degrees out of 1.09 degrees) is human-induced. According to Stefani’s analysis, the solar influence accounts for 30-70%.

Stefani examined the course of the geomagnetic aa – index, which reflects the strength of the earth’s magnetic field. This index has been measured in Cambridge and Melbourne since 1844 and reflects the influence of solar activity. In earlier publications, Stefani had already been able to prove that the 11-year solar cycle is triggered by the gravitational forces of Venus, Earth and Jupiter, which are in orbital resonance every 11.07 years (here, here and here).

Since the Sun – influenced by all the planets (especially Jupiter and Saturn) – also moves around the center of gravity of the solar system, solar cycles arise that have become known in temperature history as the 193-year Suess-de Vries cycle and the 90-year Gleissberg cycle.

Physicists: Climate Model Error Overestimates CO2 Impact On Global Temps By Factor Of 5

by K. Richard, Nov 22, 2021 in NoTricksZone


A new study suggests CO2 molecules have little consequential impact affecting outgoing radiation, and that climate models attribute global temperature effects to CO2 that are fundamentally erroneous.

Russian physicists (Smirnov and Zhilyaev, 2021) have published a peer-reviewed paper in the Advances in Fundamental Physics Special Issue for the journal Foundations.

They assesses the role of CO2 molecules in the standard atmosphere and assert “we have a contradiction with the results of climatological models in the analysis of the Earth’s greenhouse effect.”

Key points from the paper include the following:

1. Climate model calculations of CO2’s impact on global temperatures are in error by a factor of 5 as a result of “ignoring, in climatological models, the Kirchhoff law” which says radiators are “simultaneously the absorbers.”

2. Change in the concentration of an optically active atmospheric component (like CO2) “would not lead to change in the outgoing radiative flux.”

3. CO2 molecules “are not the main radiator of the atmosphere.” Water vapor molecules are, and thus they “may be responsible for the observed heating of the Earth.”

Is The Earth Actually Getting Hotter?

by V. Jayaraj, Aug 2, 2021 in ClimateChangeDispatch


Every year, climate-change enthusiasts tell us the earth is getting hotter. Phys.org warned the world, “New ‘hottest year on record’ likely to occur in the next five years.”

C2ES informed readers, “It’s certain: The Earth is getting warmer, and human activity is largely to blame.” Bulletin of the Atomic Scientists’ headline read, “Broken record: The planet is getting hotter. And hotter. And hotter.”

But are we really observing record hot years consecutively?

While global warming is real and has been happening since the end of the Little Ice Age in the 18th century, the claims surrounding unprecedented temperatures are, at best, highly dubious.

Reality and some climate change claims differ as much as day and night. Here are two examples.

Strange Things: Readjusted Data Points

A few official agencies across the globe are widely considered “leaders” or “authoritative” in disseminating climate data.

Among them is the Met Office in the UK and top U.S. state agencies like the National Oceanic and Atmospheric Administration (NOAA) and the National Aeronautics and Space Administration (NASA).

However, these agencies have used their near-invincible status to adjust climate data points as they please, often resulting in an exaggerated warming trend.

NASA has been found to have adjusted past temperature data downward to make the present temperature levels look comparatively warmer.

In July 2021, geologist Roger Higgs demonstrated how NASA lowered the 2016 data point for annual global mean temperature.

NASA carried out the supposed downward shifting of data points so that the temperature levels for 2020 (which were about the same as 2016) would now appear more extreme. Higgs revealed the downward shifting on Researchgate.

Why did NASA adjust the 2016 data point to make it appear that 2020 beat it by a larger margin than originally appeared? You decide.

Growth of Glaciers: Greenland Registers Historic Increase in Surface Mass Balance for July 2021

Greenland ice has been a topic of discussion ever since climate change became a headline item in news circles. The reduction of ice mass is often projected as proof of global warming.

Hansen’s 1988 global-warming prediction was thrice observation

by C. Monckton of Brenchley, Apr 21 , 2021, in WUWT


James Hansen is often debited with having stirred up so much alarm with his notorious 1988 prediction of runaway global warming in front of the U.S. Senate that IPeCaC was hastily founded later that year, so as to Save The Planet.

His prediction ran to 2020. How, then, did fantasy-land compare with more than two decades of sober, observed reality? The graph, zeroed so that the 1988 HadCRUT4 observed anomaly lies between Hansen’s three scenarios, shows that observed warming was closest to Hansen’s Scenario C.

However, the assumption underlying Scenario C is that everyone would be so scared following Hansen’s Senate testimony that what is now called “net-zero” would be achieved by 2000. Well, it wasn’t. And it won’t be, even by 2050. The chief reason is discernible in the Texas electricity grid collapse.

The Lone Star State, which ought to have had more common sense, decided that once it had carpeted the state with windmills (14th-century technology to fail to solve a 21st-century non-problem) and solar panels (produced by slave labor in China) it could reduce its dispatchable thermal grid capacity.

However, as any grid manager will tell you, you can’t do that. Not the least of the reasons why unreliables are so cripplingly expensive is that it is necessary to maintain the entire pre-existing grid regardless of how many unreliables are bolted on to it. Unreliables, therefore, inflict not only a deadweight cost but also a deadweight surplus capacity to the grid, to say nothing of the costly instability caused by giving unreliables precedence over thermal in meeting demand.