Archives par mot-clé : Pause

Man Made Global Warming

by P. Homewood, Apr 14, 2024 in NotaLotOfPeopleKnowThat


image

http://web.archive.org/web/20130927101652/https://www.metoffice.gov.uk/media/pdf/q/0/Paper2_recent_pause_in_global_warming.PDF

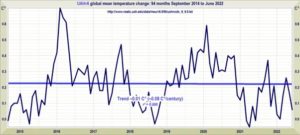
Once upon a time there was The Pause.

For a decade and a half, global temperatures stopped rising, an embarrassment for climate scientists. Even the Met Office published a long study in 2013 into the possible reasons.

But while one team at the Met Office were scratching their heads, another was busy at work eliminating the problem.

After all, if the data does not support the theory, you simply change the data.

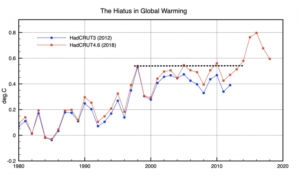
The Met Office’s Hadley Centre, in conjunction with the disgraced Climate Research Unit at the UEA, had for years published their global temperature series known as HADCRUT3. They regarded it as the gold standard of datasets.

But just a year after the Met Office’s paper on the pause, a new version was rushed out, HADCRUT4, which conveniently removed that pause.

By 2014, when HADCRUT3 was formally replaced, the new version had added about a tenth of a degree to warming since 2000.

The New Pause lengthens to 8 years 9 months

by C. Monckton of Brenchley, Apr 2023 in WUWT


The New Pause has lengthened to 8 years 9 months. The least-squares linear-regression trend on the UAH monthly satellite global-temperature dataset shows no global warming from July 2015 to March 2023. As usual, this site is just about the only place where this continuing failure of global temperatures to do as they are told is reported.


The start and end dates of the New Pause are not cherry-picked. The end date is the present; the start date is the farthest back one can reach and still find a zero trend. It is what it is.

For comparison, here is the entire dataset for 44 years 4 months since December 1978. It shows a less than terrifying long-run warming rate equivalent to 1.3 degrees/century, of which 0.3 K has already occurred since January 2021, leaving just 1 K to go (on the current trend) until 2100, by which time reserves of coal, oil and gas will be largely exhausted.

The New Pause Lengthens to 8 Years

by C. Monckton of Brenchley,  Oct 6, 2022 in WUWT


The New Pause, having paused a month ago, has now lengthened again: this time to exactly eight years. As always, the Pause is calculated as the longest period for which the least-squares linear-regression trend up to the most recent month for which the UAH global mean surface temperature anomaly is available is zero.


The trend on the entire dataset during the 526 months from December 1978 to September 2022 is 0.95 C°, equivalent to only 1.34 C°/century. So slow a rate of warming is well within the natural variability of the climate, and is proving net-beneficial.

The New Pause has grown to fully eight years in length at a most embarrassing point for true-believers: for the cost to the West of the economically suicidal policies that they have long advocated is now becoming all too painfully apparent, just as it is also ever more evident that the warming since 1990 is well below half the midrange prediction made by IPCC that year.


Global Warming Has Stalled Over Much Of The Last 10 Years, Arctic Never Melted Away

by P. Gosselin, July, 22, 2022 in NoTrickZone


The globe hasn’t been warming and the Arctic hasn’t been melting much for almost a decade now.

Recall the climate crisis loonies warned us some 20 years ago the Arctic sea ice would disappear by the summer of 2014. Well it’s still very much there, as Joe Bastardi reminds us at his most recent Saturday Summary:

No warming in 8 years

Moreover, UAH global mean temperature anomaly hasn’t risen in eight years as well, Hat-tip Snowfan here:

….

The New Pause Lengthens to 7 Years 10 Months

by C. Monckton of Brenchley, July 2, 2022 in WUWT


The New Pause paused last month because I was ill. Many apologies for the interruption. Now, however, it resumes – and it has lengthened from 7 years 7 months to the end of April 2022. To the end of June 2022, the New Pause is now 7 years 10 months in length:


This Pause, like its predecessor, which was an impressive 18 years 8 months (UAH), or 18 years 9 months (HadCRUT4), is, as always, not cherry-picked. It is derived from the UAH monthly global mean lower-troposphere temperature anomalies as the period from the earliest month starting with which the least-squares linear-regression trend to the most recent month for which data are available does not exceed zero. Whatever the data show, I show. Or, in the immortal words of Dr Roy Spencer, speaking of his dataset, “It is what it is”. In that splendid dictum speaks all true science.

The least-squares trend, which Professor Jones at the University of East Anglia used to recommend as the simplest and most robust method of deriving global-temperature trends, takes due account of all monthly values, not merely of the starting and ending values.


See also here

The New Pause lengthens yet again

by C. Monckton of Brenchley, Sept 2, 2021 in WUWT


The New Pause has again lengthened by another two months. On the normative UAH lower-troposphere dataset there has been no global warming over the 6 years 8 months from January 2015 to August 2021. As always, the Pause is calculated as the longest period ending in the present that shows no warming trend, taken as the least-squares linear-regression trend on the UAH satellite monthly global mean surface temperature anomalies for the lower troposphere:

The New Pause lengthens again

by C. Monckton of Brenchley, Aug 3 2021 in WUWT


The New Pause has lengthened by another two months. Even though the brief la Niña that began in late 2020 has now ended, on the UAH dataset there has been no global warming for 6 years 6 months till July 2021. As always, the Pause is calculated as the longest period ending in the present that shows no warming trend, taken as the least-squares linear-regression trend on the UAH satellite monthly global mean surface temperature anomalies for the lower troposphere:

….

Climate Models: No Warming For 30 Years – Possibly

by Maher et al., May 12, 2020 in GWPF


A new study demonstrates how a prolonged warming pause or even global cooling may happen in coming years despite increasing levels of atmospheric greenhouse gases — caused by natural climatic variability.

Natural climatic variability has always been a topic that contains a lot of unknowns, but it has been rarely explicitly stated just how little we know about it. Such variability has been habitually underplayed as it was “obvious” that the major driver of global temperature was the accumulation of greenhouse gasses in the atmosphere, with natural variability a weaker effect.

But the global temperature data of this century demonstrate that natural variability has dominated in the form of El Ninos. ‘Doesn’t matter’, came the reply, ‘just wait and the signal of greenhouse warming will emerge out of the noise of natural climatic variability.’ How long will we have to wait for that signal? Quite a long time, according to some researchers as more papers acknowledge that natural climatic variability has a major, if not a dominant influence on global temperature trends.

With the usual proviso concerning climatic predictions there seems to be a growing number of research papers suggesting that the global average temperature of at least the next five years will remain largely unchanged. The reason: natural climatic variability.

Only last week the UK Met Office produced figures suggesting that there is only a 1 in 34 chance that the 1.5°C threshold will be exceeded for the next five year period. Now a new paper by climate modellers extends such predictions, suggesting that because of natural variability the average global temperature up to 2049 could remain relatively unchanged – even with the largest increase in greenhouse gas emissions.

Using two types of computer models in a first of its kind study, Nicola Maher of the Max Planck Institute for Meteorology, Hamburg, Germany, and colleagues writing in Environmental Research Letters looked at the 2019-2034 period concluding that,

The Great Failure Of The Climate Models

by Tyler Durden, 26 August 2019 in ZeroHedge


….

Christy is not looking at surface temperatures, as measured by thermometers at weather stations. Instead, he is looking at temperatures measured from calibrated thermistors carried by weather balloons and data from satellites. Why didn’t he simply look down here, where we all live? Because the records of the surface temperatures have been badly compromised.

Globally averaged thermometers show two periods of warming since 1900: a half-degree from natural causes in the first half of the 20th century, before there was an increase in industrial carbon dioxide that was enough to produce it, and another half-degree in the last quarter of the century.

The latest U.N. science compendium asserts that the latter half-degree is at least half manmade. But the thermometer records showed that the warming stopped from 2000 to 2014. Until they didn’t.

In two of the four global surface series, data were adjusted in two ways that wiped out the “pause” that had been observed.

The first adjustment changed how the temperature of the ocean surface is calculated, by replacing satellite data with drifting buoys and temperatures in ships’ water intake. The size of the ship determines how deep the intake tube is, and steel ships warm up tremendously under sunny, hot conditions. The buoy temperatures, which are measured by precise electronic thermistors, were adjusted upwards to match the questionable ship data. Given that the buoy network became more extensive during the pause, that’s guaranteed to put some artificial warming in the data.

The second big adjustment was over the Arctic Ocean, where there aren’t any weather stations. In this revision, temperatures were estimated from nearby land stations. This runs afoul of basic physics.


The pause in global warming shows CO2 may be *more* powerful! Say hello to Hyperwarming Wierdness.

by JoNova, July 24, 2019


It’s all so obvious. If researchers start with models that don’t work, they can find anything they look for — even abject nonsense which is the complete opposite of what the models predicted.

Holy Simulation! Let’s take this reasoning and run with it  — in the unlikely event we actually get relentless rising temperatures, that will imply that the climate sensitivity of CO2 is lower. Can’t see that press release coming…

Nature has sunk so low these days it’s competing with The Onion.

The big problem bugging believers was that global warming paused, which no model predicted, and which remains unexplained still, despite moving goal posts, searching in data that doesn’t exist, and using error bars 17 times larger than the signal. The immutable problem is that energy shalt not be created nor destroyed, so The Pause still matters even years after it stopped pausing. The empty space still shows the models don’t understand the climate — CO2 was supposed to be heating the world, all day, everyday. Quadrillions of Joules have to go somewhere, they can’t just vanish, but models don’t know where they went. If we can’t explain the pause, we can’t explain the cause, and the models can’t predict anything.

In studies like these, the broken model is not a bug, it’s a mandatory requirement — if these models actually worked, it wouldn’t be as easy to produce any and every conclusion that an unskeptical scientist could hope to “be surprised” by.

The true value of this study, if any, is in 100 years time when some psychology PhD student will be able to complete an extra paragraph on the 6th dimensional flexibility of human rationalization and confirmation bias.

Busted climate models can literally prove anything. The more busted they are, the better.

More sensitive climates are more variable climates

University of Exeter

A decade without any global warming is more likely to happen if the climate is more sensitive to carbon dioxide emissions, new research has revealed.

HOW CAN SO MANY SCIENTISTS BE SO WRONG ABOUT THE PAUSE?

by David Whitehouse, December 20, 2018 in GWPF


Using simple statistics it looked at and dismissed over 200 peer-reviewed papers that analysed the pause and concluded it was a real phenomenon. How did they, and the IPCC, get it all so wrong?

Source: Clive Best

Nobody who keeps an eye on climate research will be at all surprised by this “new” paper. Its conclusions were well aired in April 2018 at a meeting of the European Geophysical Union.

The authors must have been rather frustrated at the time as the paper describing their work had been submitted to the journal Environmental Research Letters over a year earlier, in February 2017 in fact, still had not been published. This was remedied a few days ago when it was finally published — one year and nine months after its submission!