Archives par mot-clé : Ice

Arctic sea ice: Simulation versus observation

by U.  of California – Santa Barbara, Nov 13, 2018 in ScienceDaily


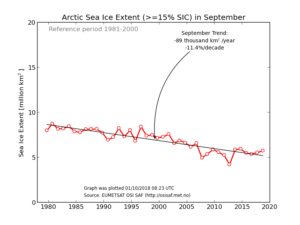
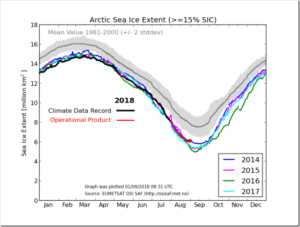
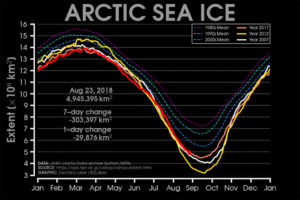
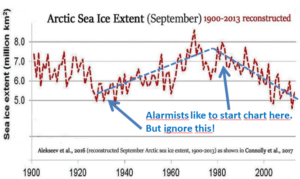
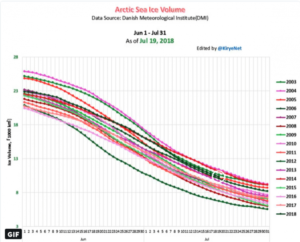
As an indicator of the impacts of climate change, Arctic sea ice is hard to beat. Scientists have observed the frozen polar ocean advance and retreat at this most sensitive region of the Earth over decades for insight on the potential ripple effects on assorted natural systems: global ocean circulation, surrounding habitats and ecosystems, food sources, sea levels and more.

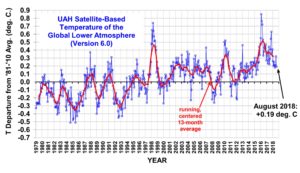
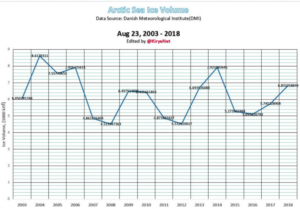
“We’re mostly interested in the period from the early 2000s to the present day, where we see such strong melting,” said graduate student Ian Baxter, who also works with Ding. It’s known, he added, that the effects of changes in the Arctic are no longer confined to the region and in fact spread to the mid-latitudes — often in the form of cold weather outbreaks. The group is interested in how effects in the tropics could spread beyond that region and affect the Arctic.

How the Greenland ice sheet fared in 2018

by R. Mottram et al.  (DMI), October 27, 2018 in ScienceNordic


The end of August traditionally marks the end of the melt season for the Greenland ice sheet as it shifts from mostly melting to mostly gaining snow.

As usual, this is the time when the scientists at DMI and our partners in the Polar Portal assess the state of the ice sheet after a year of snowfall and ice melt. Using daily output from a weather forecasting model combined with a model that calculates melt of snow and ice, we calculate the “surface mass budget” (SMB) of the ice sheet.

This budget takes into account the balance between snow that is added to the ice sheet and melting snow and glacier ice that runs off into the ocean. The ice sheet also loses ice by the breaking off, or “calving”, of icebergs from its edge, but that is not included in this type of budget. As a result, the SMB will always be positive – that is, the ice sheet gains more snow than the ice it loses.

For this year, we calculated a total SMB of 517bn tonnes, which is almost 150bn tonnes above the average for 1981-2010, ranking just behind the 2016-17 season as sixth highest on record.

By contrast, the lowest SMB in the record was 2011-2012 with just 38bn tonnes, which shows how variable SMB can be from one year to another.

Maps show the difference between the annual SMB in 2017 (left) and 2018 (right) compared with the 1981-2010 period (in mm of ice melt). Blue shows more ice gain than average and red shows more ice loss than average. (Credit: DMI Polar Portal)

19th century glacier retreat in the Alps preceded the emergence of industrial black carbon deposition on high-alpine glaciers

by M. Sigl et al., October 16, 2018 in TheCryosphere


Abstract. Light absorbing aerosols in the atmosphere and cryosphere play an important role in the climate system. Their presence in ambient air and snow changes the radiative properties of these systems, thus contributing to increased atmospheric warming and snowmelt. High spatio-temporal variability of aerosol concentrations and a shortage of long-term observations contribute to large uncertainties in properly assigning the climate effects of aerosols through time.

Starting around AD1860, many glaciers in the European Alps began to retreat from their maximum mid-19th century terminus positions, thereby visualizing the end of the Little Ice Age in Europe. Radiative forcing by increasing deposition of industrial black carbon to snow has been suggested as the main driver of the abrupt glacier retreats in the Alps. The basis for this hypothesis was model simulations using elemental carbon concentrations at low temporal resolution from two ice cores in the Alps.

Pas d’erreurs pour l’Arctique!

by Paul Berth, 21 octobre 2018 in ScienceClimatEnergie


Comme mentionné dans un article précédent, le DMI (Danish Meteorological Institute) publie régulièrement l’évolution temporelle, mois par mois, de l’étendue de la glace de l’Arctique en millions de km2. Le dernier graphique publié (Fig. 1) nous montre l’étendue de la glace au mois de septembre entre 1979 et 2018 (c’est au mois de septembre que l’étendue de glace arctique est la plus faible, moins de 10 millions de km2). Une droite, dont la pente est négative, est tracée parmi les points : tous les 10 ans, la surface semble diminuer de 11,4%. Si l’on extrapole la droite ont peut calculer qu’il n’y aura plus de glace en Arctique dans 60 ans. Cependant, ne remarquez-vous rien d’étrange sur ce graphique?

….

New Science: Arctic AND Antarctic Sea Ice More Extensive Today Than Nearly All Of The Last 10,000 Years

by K. Richard, October 18, 2018 in NoTricksZone


It is often claimed that modern day sea ice changes are “unprecedented”, alarming, and well outside the range of natural variability.  Yet scientists are increasingly finding that biomarker proxies used to reconstruct both Arctic and Antarctic sea ice conditions since the Early Holocene reveal that today’s sea ice changes are not only not unusual, there is more extensive Arctic and Antarctic sea ice during recent decades than there has been for nearly all of the last 10,000 years.

Another Dis-alarming Analysis of Arctic Sea Ice David Middleton / 17 hours ago September 26, 2018

by David Middleton, September 26, 2018 in WUWT


Anthony recently posted an excellent Arctic sea ice analysis by Ron Clutz.  In a similar vein, I decided to look at Arctic sea ice from a couple of other dis-alarming perspectives.

We keep hearing about the Arctic being ice-free anytime from next month up until a continuously rolling forward decade or so.  One question that has to be answered is:

What does ice-free mean?

When does ice-free mean ice-free?

First, we need to clarify what exactly an “ice-free” Arctic summer is.

By “ice-free”, scientists usually mean a sea ice extent of less than one million square kilometres, rather than zero sea ice cover.

–Dr Alexandra Jahn, Assistant Professor in the Department of Atmospheric and Oceanic Sciences and Fellow at the Institute of Arctic and Alpine Research at the University of Colorado. Carbon Brief, August 25, 2016.

Retracing Antarctica’s glacial past

by Louisiana State University, September 25, 2018 in ScienceDaily


More than 26,000 years ago, sea level was much lower than it is today partly because the ice sheets that jut out from the continent of Antarctica were enormous and covered by grounded ice — ice that was fully attached to the seafloor. As the planet warmed, the ice sheets melted and contracted, and sea level began to rise. Researchers have discovered new information that illuminates how and when this global phenomenon occurred.

More recently in 2002, in the northern part of Antarctica called the Antarctic Peninsula, the Larsen Ice Shelf collapsed. The collapse of this ice shelf quickly led to inland glaciers buttressed by the Larsen Ice Shelf to break up and melt. Scientists have thought that a similar process could have occurred when the Ross Ice Shelf collapsed thousands of years ago in the West Antarctic Ice Sheet.

However, Bart and colleagues from the University of South Florida, Auburn University and the Polish Academy of Sciences found that there was a centuries-long delay from when the Ross Ice Shelf collapsed and the grounded ice began to contract. In the Ross Sea, the delay was between 200 to 1,400 years later. This new information adds a layer of complexity for sea level rise computer simulations and predictions.

Arctic Ice Made Simple

by Ron Clutz, September 22, 2018 in ScienceMatters


People are overthinking and over-analyzing Arctic Ice extents, and getting wrapped around the axle (or should I say axis).  So let’s keep it simple and we can all readily understand what is happening up North.

I will use the ever popular NOAA dataset derived from satellite passive microwave sensors.  It sometimes understates the ice extents, but everyone refers to it and it is complete from 1979 to 2017.  Here’s what NOAA reports (in M km2):

Negative climate feedback: more ships in the Arctic mean more cooling

by Anthony Watts, September 17, 2018 in WUWT


This article claim ships will “be able to sail right over the North Pole” by 2050 due to warming, but at the same time say ship tracks will make more clouds and cool the Arctic. Of course, anything is possible with the help of climate models.


More ships and more clouds mean cooling in the Arctic

With sea ice in the Arctic melting at an alarming rate, opportunities for trans-Arctic shipping are opening up, and by mid-century ships will be able to sail right over the North Pole – something not previously possible for humankind.

Back To Reality

by P.  Homewood, September 2, 2018 in NotaLotofPeopleKnowThat


Global temperatures fell back to 0.19C in August. This means the YTD average is 0.23C, putting them back to roughly where they were in 2002.

Arctic sea ice is tracking close to 2014, which finished with one of the highest minimums in the last decade. Current extent is well above the last three years.


Ralentissement de la fonte de la banquise Arctique : pas de record en 2018

by Météo Paris, 25 août 2018


Malgré des températures particulièrement élevées ces dernières semaines sur l’Hémisphère Nord, voire exceptionnelles sur l’Europe, le déclin des glaces de l’Arctique s’est vu ralenti.

Au 23 août, l’étendue des glaces de l’Arctique était d’approximativement 4.945 millions de kilomètres carrés. Des niveaux toujours particulièrement bas au regard de la moyenne observée sur la période 1981-2010 (6.866 millions de km2, soit un déficit de 28%). Néanmoins, ce niveau n’est « que » le 6e plus bas observé à cette date, très loin de la triste année 2012 (une superficie inférieure à 4 millions de km2 à la fin août). Une timide amélioration, puisque l’étendue de ces glaces avait alors été la 4e plus faible jamais observée sur l’ensemble du mois de juin.


Graphique de l’étendue des glaces de l’océan Arctique (en millions de km2) – Zachary Michael Labe

nb se reporter à la courbe rouge/see red curve

Arctic Summer Sea Ice Growth Trend Extends Another Year …Greenland Summer One Of Coldest In 30 Years!

by P. Gosselin, August 24, 2018 in NoTricksZone


As the Arctic summer ice melt approaches its peak, we can say with high certainty that this year’s ice melt will extend the trend of a rebounding Arctic ice mass by another year.

Arctic summer sea ice now growing 12 years

Our Japanese skeptic blogger and good friend Kirye reports using the data from the Danish Meteorological Institute (DMI) that peak summer Arctic sea ice volume upward growth trend has been extended yet another year – now 12 years.

Chart by Kirye. Data source: Danish Meteorology Institute (DMI).

Charlatans Of The Arctic… Laughing Stock Ice-Free-Arctic Predictions …Fake Science At Its Best

by P. Gosselin, July 21, 2018 in NoTricksZone


Recently climate catastrophe non-believers have been pointing out that Arctic sea ice volume has been gaining over the past years and has not trended downward for some dozen years now.

And global warming alarmists have been very silent on the subject of climate change now that global surface temperatures have cooled and Arctic and Greenland snow and ice have rebounded.

Embarrassed, they don’t want to be reminded of all the absurd predictions they made 10 years ago, with some as recently as just five years ago.

Sea Ice Model Projections In A Death Spiral! Arctic Ice Volume Holds Steady For A Decade!

by P. Gosselin, July 10, 2018 in NoTricksZone


Lately Arctic sea ice volume has been a topic which climate skeptics have been looking at quite closely.

According to Al Gore and a number of climate ambulance chasers, Arctic sea ice in late summer should have long disappeared by now, see here..

But then just a few years after, the Arctic sea ice area began to recover from its lows of 2007 and 2012. So immediately alarmists shouted that area was not really what mattered, but rather sea ice volume is what really counted. Okay, that made perfect sense. Mass is in fact what’s important, and not area, when worrying about polar ice disappearing …

Against The Forecasts: Sea Ice Grows…Surface Temperatures Fall… Troposphere Cools…Polar Regions Stable!

by P.  Gosselin, July , 2018 in NoTricksZone


German climate and weather analyst “Schneefan” (Snow Fan) here writes a summary of the first half of 2018 thus far. All data show that the surface temperature of the globe has been cooling strongly over the past months and polar ice mass growing.

He writes that in the first half of this year we have seen weak solar activity and La Nina conditions acting to cool the globe’s surface. Moreover Arctic and Antarctic ice mass have grown in comparison to the previous years. …