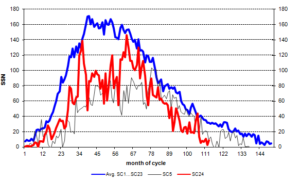
The sun was inactive in April, as we currently find ourselves in the minimum between solar cycle (SC) 24 and the coming solar cycle 25.
The recorded mean sunspot number (SSN) for April was 8.9, which is only 28% of what is usual 113 months into a solar cycle. In April, 16 days were spotless. The following chart shows sunspot activity (…)
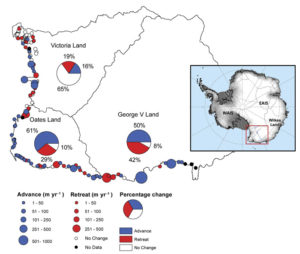
In describing their findings, Lovell et al. state that “between 1972 and 2013, 36% of glacier termini in the entire study area advanced and 25% of glacier termini retreated, with the remainder showing no discernible change outside of the measurement error (± 66 m or ± 1.6 m yr-1) and classified as ‘no change'” (see figure below). Although there were some regional differences in glacier termini changes, these regions over the last four decades were more closely linked to non-climatic drivers, such as terminus type and geometry, than any obvious climatic or oceanic forcing.”
by Tony Heller, May 22, 2018 in TheDeplorableClimateScienceBlog
Settled science at NASA means constantly rewriting the past. Here are a few of the NASA Reykjavik, Iceland temperature graphs I have captured over the past six years.
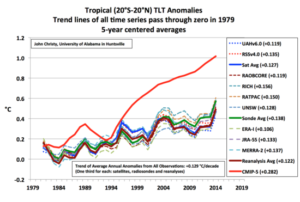
Monitoring temperature and creating regional and global temperature data sets is a tricky business. There are many factors that can induce spurious trends in the data; and there are multiple protocols to follow to ensure their proper construction. Consequently, many people (including scientists) have found themselves wondering which of all the temperature data sets is the most accurate for use in determining the impact of rising greenhouses gases on atmospheric temperature? Thanks to the recently published work of Christy et al. (2018), we now have a pretty good idea as to the answer.
Weather Satellite Wanders Through Time, Space, Causing Stray Warming to Contaminate Data
In the late 1990s, the NOAA-14 weather satellite went wandering through time and space, apparently changing the record of Earth’s climate as it went.
Designed for an orbit synchronized with the sun, NOAA-14’s orbit from pole to pole was supposed to cross the equator at 1:30 p.m. on the sunlit side of the globe and at 1:30 a.m. on the dark side, 14 times each day. One of the instruments it carried was a microwave sounding unit (MSU), which looked down at the world and collected data on temperatures in Earth’s atmosphere and how those temperatures changed through time.
A funny thing happens when you line up satellite and surface temperatures over Australia. A lot of the time they are very close, but some years the surface records from the Australian Bureau of Meteorology (BOM) are cooler by a full half a degree than the UAH satellite readings. Before anyone yells “adjustments”, this appears to be a real difference of instruments, but solving this mystery turns up a rather major flaw in climate models (…)
I got to thinking about the “hiatus” in warming in the 21st Century, and I realized that the CERES satellite dataset covers the period since the year 2000. So I’ve graphed up a few views of the temperature changes over the period of the CERES record, which at present is May 2000 to February 2017. No great insights, just a good overview and some interesting findings.
Global Temperature Report: December 2017 Global climate trend since Nov. 16, 1978: +0.13 C per decade December temperatures (preliminary)
Global composite temp.: +0.41 C (about 0.74 degrees Fahrenheit) above 30-year average for December.
Northern Hemisphere: +0.50 C (about 0.90 degrees Fahrenheit) above 30-year average for December.
Southern Hemisphere: +0.33 C (about 0.59 degrees Fahrenheit) above 30-year average for December.
Tropics: +0.26 C (about 0.47 degrees Fahrenheit) above 30-year average for November.
The average global temperature drop between October and November, 2017, tied for the fifth largest one-month-to-the-next drop in the 39-year satellite temperature record, according to Dr. John Christy, director of the Earth System Science Center (ESSC) at The University of Alabama in Huntsville. Compared to seasonal norms, the average temperature around the globe fell 0.27 C (almost 0.49 degrees F) between October and November. (The largest drop was from January to February 2013, when the global average temperature fell 0.32 C.)
After a peak in 2012 the level went down by about 10 cm by mid 2017. It is very much related to natural variations, in sync with the El Ninos (low levels) and La Ninas (high levels).
So what remains of the climate change horror stories in connection to the Fiji Islands? (…)
September Sea Surface Temperatures (SSTs) are now available, and we see downward spikes in ocean temps everywhere, led by sharp decreases in the Tropics and SH, reversing the bump upward last month. The Tropical cooling in particular factors into forecasters favoring an unusually late La Nina appearance in coming months.
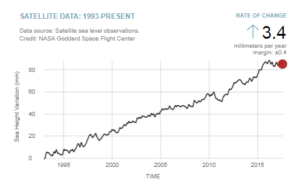
This is interesting. It appears that a “pause” has developed in global sea levels. For two years, since July 2015, there has been no sustained increase in global sea level, in fact, it appears to have actually fallen a bit. This graph, provided by NASA’s Global Climate Change website, tells the story:
Satellite observations indicate that the average Arctic sea ice extent has generally decreased since the start of the satellite records in October 1978. Is this period long enough to assess whether the current sea level trend is unusual, and to what extent the decline is caused by humans?
This change in Arctic climate is often promoted as evidence that humans are causing drastic climate change. For instance, an April 29th 2017 article in the Economist (“Skating on thin ice”, pg 16) implied that the Arctic is melting unusually, dramatically and worryingly (…)
Le site carbonbrief a publié le 30 juin 2017 un article sous le titre : « Des corrections majeures aux données satellitaires augmentent de 140% le réchauffement depuis 1998[1] »
Précisons d’abord que Les satellites ne mesurent pas directement la température. Ils sont équipés de capteurs sensibles à la luminance de l’atmosphère et de la mer dans le spectre des infrarouges. Pour en dériver la température, des traitements informatiques sur les données brutes sont nécessaires.
It’s pretty clear that the models are producing too much atmospheric warming compared to satellites, radiosondes (weather balloons), and multi-observational atmospheric reanalyses.
There are two main groups that use essentially the same NASA and NOAA satellites to estimate global temperatures. In the last year, they’ve both made adjustments, one down, and one up, getting further apart in their estimates. In ClimateWorld this is a big deal. Believers are excited that now a satellite set agrees a bit better with the maligned “hot” surface thermometers. But UAH still agrees more with millions of weather balloons. The debate continues. Here’s my short synopsis of the Roy Spencer (and John Christy) from the “Comments on the new RSS lower tropospheric temperature set.” (If something is wrong here, blame me).
For years, RSS have been an embarrassment to the climate establishment. Their satellite data has consistently shown the pause in global temperatures since 1998, which so many scientists have attempted to explain.
At the same time, the surface datasets of GISS, NOAA and HADCRUT have diverged, with the help of adjustments, to show much greater warming.
The pressure on RSS to conform has been immense, and now the inevitable has happened. Highly conveniently they have found huge errors in their previous version, and have now adjusted to a new version, v4, which miraculously finds that global warming has continued unabated after all!
Les mesures satellitaires prétendent mesurer l’élévation du niveau de la mer avec une précision millimétrique. Or La précision des radars altimétriques s’exprime en centimètres. Comment dans ces conditions parvient-on à mesurer un taux d’élévation du niveau de la mer de 3,4 mm par an sur la période 1993-2015 ?
We conclude that model overestimation of tropospheric warming in the early twenty-first century is partly due to systematic deficiencies in some of the post-2000 external forcings used in the model simulations.
The core of Salby’s theory is derived using CO2 data from MLO’s Keeling Curve since 1958, and satellite temperature data since 1979. (His few charts reaching back to 1880 contain acknowledged large uncertainties.) His theory builds off a simple observation, that in ‘official’ estimates of Earth’s carbon cycle budget, anthropogenic CO2 is only a small source compared to large natural sources and sinks.
Critical German climate site wobleibtdieererwaermung.de (WBDE) reports that the earth’s surface is cooling, and presents the latest chart from NCEP. As of April 11, the measured global values continue to decline (black curve) as do the computed values for April 18.
The time-delayed post El Niño cooling is now showing up in the UAH and RSS satellite data.
The resulting 2016 annual average global temperature anomaly is +0.50 deg. C, which is (a statistically insignificant) 0.02 deg. C warmer than 1998 at +0.48 deg. C. We estimate that 2016 would have had to be 0.10 C warmer than 1998 to be significantly different at the 95% confidence level. Both 2016 and 1998 were strong El Nino years.
See also : MIT climate scientist (Dr R. Lindzen) on ‘hottest year’