This is a two-part post. The first part is to correct an oversight in my recent post entitled Rainergy.
The second part is to use that new information to analyze the effect of clouds on the El Nino region.
So, to the first part. In my post Rainergy, I noted that it takes ~ 80 watts per square meter (W/m2) over a year to evaporate a cubic meter of seawater. Thus, the evaporation that creates the ~1 meter of annual rain cools the surface by – 80 W/m2.
Then the other day I thought “Dang! I forgot virga!”
Virga is rain that falls from a cloud but evaporates completely before it hits the ground.
Feel helpless when trying to assess the veracity of “climate doom is looming” claims? Don’t give up trying to understand the relevant basics because you don’t need to be a scientist to do so.
There is a rather simple way to get an idea about what this is all about. Even without a scientific background, most people have at least a good common sense. And that’s all it takes to get a grasp of how energy flows back and forth between earth’s surface and the skies.
Today in Part 5, we look at the linkage between the allegedly CO2-driven rise of air and sea surface temperatures on the one side and the disconnect between these increases and their strangely weak to insignificant impact on rainfall and hurricane intensity”.
Variability of cloud effects vs “greenhouse gas” effects
In the last chapter, we have seen that there are some discrepancies between the global warming trend as claimed by the official climate science and the local evolution of rainfall, which should be a direct consequence of higher temperatures since this causes more evaporation. This seems not to be the case e.g. for Germany, see Fig. 1:
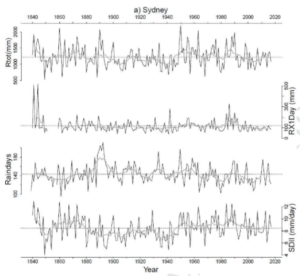
A new study appearing in the Journal of Weather and Climate Extremes titled “Historical extreme rainfall events in southeastern Australia” – led by LindenAshcroft, School of Earth Sciences, University of Melbourne – shows that even more extreme weather in terms of rainfall existed before 1900 in Melbourne, Sydney and Adelaide.
No real trend when examining Sydney, Australia data going back 178 years. Image: Ashcroft et al 2019.
Moreover, the authors found a “moderate and relatively stable relationship between El Niño–Southern Oscillation (ENSO) and annual variations of total rainfall and the number of raindays.”
A funny thing happens when you line up satellite and surface temperatures over Australia. A lot of the time they are very close, but some years the surface records from the Australian Bureau of Meteorology (BOM) are cooler by a full half a degree than the UAH satellite readings. Before anyone yells “adjustments”, this appears to be a real difference of instruments, but solving this mystery turns up a rather major flaw in climate models (…)
by Paul Homewood, January 8, 2018 in NotaLotofPeopleKnowThat
The England & Wales Precipitation Series has now been updated for last year.
Precipitation totalled 952mm during the year, slightly above the series average of 918mm. In ascending order, 2017 ranked 158th.
There seems to be little evidence of any real trends. Whatever trend can be winkled out of the numbers will likely be too small to notice, and swamped by the natural variability in the data.
The wettest years remain 1872 and 1768. The driest were 1788 and 1921.
La géologie, une science plus que passionnante … et diverse