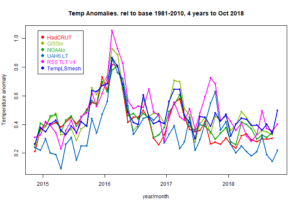
As you’ll soon see, there was an eye-catching uptick (+0.25 deg C) in the GISS global Land-Ocean Temperature Index (LOTI) data from September to October 2018. We’ll have to wait for next month’s update to see if it also appears in the NOAA and Met Office datasets.
…
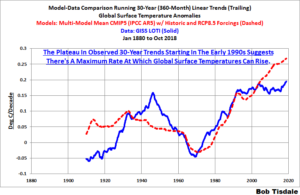
Figure 8
There are numerous things to note in the trend comparison. First, there is a growing divergence between models and data starting in the early 2000s. The continued rise in the model trends indicates global surface warming is supposed to be accelerating, but the data indicate little to no acceleration since then. Second, the plateau in the data warming rates begins in the early 1990s, indicating that there has been very little acceleration of global warming for more than 2 decades. This suggests that there MAY BE a maximum rate at which surface temperatures can warm. Third, note that the observed 30-year trend ending in the mid-1940s is comparable to the recent 30-year trends. (That, of course, is a function of the new NOAA ERSST.v5 data used by GISS.) Fourth, yet that high 30-year warming ending about 1945 occurred without being caused by the forcings that drive the climate models. That is, the climate models indicate that global surface temperatures should have warmed at about a third that fast if global surface temperatures were dictated by the forcings used to drive the models. In other words, if the models can’t explain the observed 30-year warming ending around 1945, then the warming must have occurred naturally. And that, in turns, generates the question: how much of the current warming occurred naturally? Fifth, the agreement between model and data trends for the 30-year periods ending in the 1960s to about 2000 suggests the models were tuned to that period or at least part of it. Sixth, going back further in time, the models can’t explain the cooling seen during the 30-year periods before the 1920s, which is why they fail to properly simulate the warming in the early 20thCentury.
One last note, the monumental difference in modeled and observed warming rates at about 1945 confirms my earlier statement that the models can’t simulate the warming that occurred during the early warming period of the 20th Century.
The year 2018 could mark the beginning of the end of climate change alarmist reporting. Projections of catastrophic melting of the ice sheets and sea level rise swallowing up the Earth’s coasts are increasingly undermined by observation.
…
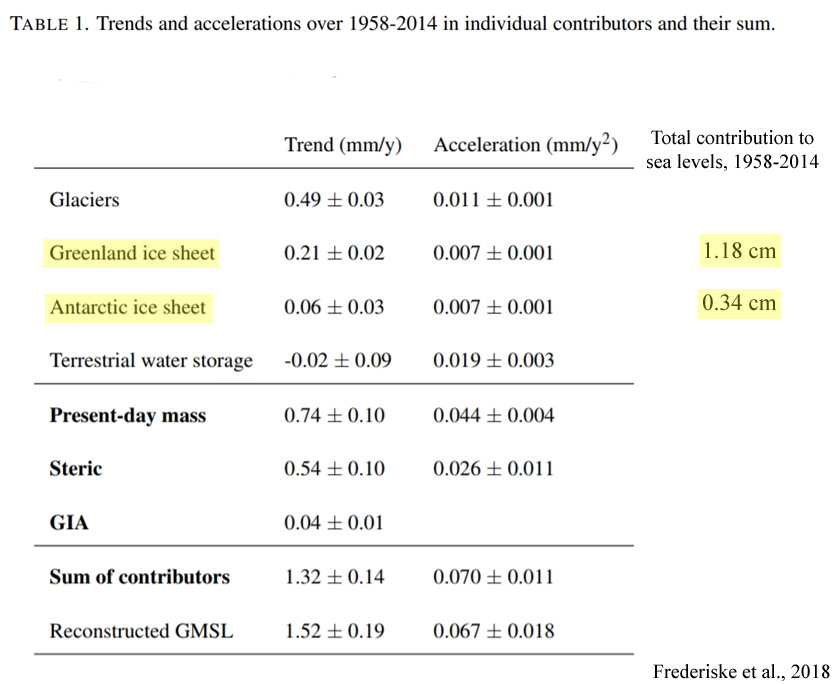
Despite the hackneyed practice of reporting “staggering” ice sheet melt for both Greenland and Antarctica in recent decades, the two polar ice sheets combined to add just 1.5 centimeters to sea level rise between 1958 and 2014 (graphfrom Frederikse et al., 2018) as global sea levels only rose by “1.5 ± 0.2 mm yr−1 over 1958–2014 (1σ)” or “1.3 ± 0.1 mm yr−1 for the sum of contributors”.
That’s about 7.8 centimeters (3.1 inches) of global sea level change in 56 years.
by M. Bastasch, November 14, 2018 in WUWT/DailyCaller
Scientists behind a headline-grabbing climate study admitted they “really muffed” their paper.
Their study claimed to find 60 percent more warming in the oceans, but that was based on math errors.
The errors were initially spotted by scientist Nic Lewis, who called them “serious (but surely inadvertent) errors.”
The scientists behind a headline-grabbing global warming study did something that seems all too rare these days — they admitted to making mistakes and thanked the researcher, a global warming skeptic, who pointed them out.
“When we were confronted with his insight it became immediately clear there was an issue there,” study co-author Ralph Keeling told The San Diego Union-Tribune on Tuesday.
Their study, published in October, used a new method of measuring ocean heat uptake and found the oceans had absorbed 60 more heat than previously thought. Many news outlets relayed the findings, but independent scientist Nic Lewis quickly found problems with the study.
There is much criticism here of the estimates of global surface temperature anomaly provided by the majors – GISS, NOAA and HADCRUT. I try to answer these specifically, but also point out that the source data is readily available, and it is not too difficult to do your own calculation. I point out that I do this monthly, and have done for about eight years. My latest, for October, is here (it got warmer).
Last time CharlesTM was kind enough to suggest that I submit a post, I described how Australian data made its way, visible at all stages, from the 30-minute readings (reported with about 5 min delay) to the collection point as a CLIMAT form, from where it goes unchanged into GHCN unadjusted (qcu). You can see the world’s CLIMAT forms here; countries vary as to how they report the intermediate steps, but almost all the data comes from AWS, and is reported at the time soon after recording. So GHCN unadjusted, which is one of the data sources I use, can be verified. The other, ERSST v5, is not so easy, but there is a lot of its provenance available.
My calculation is based on GHCN unadjusted. That isn’t because I think the adjustments are unjustified, but rather because I find adjustment makes little difference, and I think it is useful to show that.
I’ll describe the methods and results, but firstly I should address that much-argued question of why use anomalies.
Popular accounts of shale oil and gas reservoirs are often riddled with errors and, even when technically correct, often misleading. As a shale petrophysicist, retired from Devon Energy, I thought I would try and explain, in a non-technical way, how these reservoirs work and why they have been so successful.
…
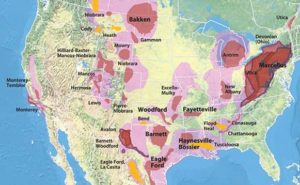
Figure 1. Major shale oil and gas plays in the United States. Source EIA.
This story was previously discussed here at WUWT… But, why wasn’t this headline news in the Washington Post, New York Times, etc.? Yes… That was a rhetorical question.
…
Comparisons with nearby automated weather stations suggest that air temperatures during these events are near −94 ± 4 °C or about −138 F. Ultracold conditions (below −90 °C) occur more frequently when the Antarctic polar vortex is strong. This temperature appears to be about as low as it is possible to reach, even under clear skies and very dry conditions, because heat radiating from the cold clear air is nearly equal to the heat radiating from the bitterly cold snow surface.
As an indicator of the impacts of climate change, Arctic sea ice is hard to beat. Scientists have observed the frozen polar ocean advance and retreat at this most sensitive region of the Earth over decades for insight on the potential ripple effects on assorted natural systems: global ocean circulation, surrounding habitats and ecosystems, food sources, sea levels and more.
…
“We’re mostly interested in the period from the early 2000s to the present day, where we see such strong melting,” said graduate student Ian Baxter, who also works with Ding. It’s known, he added, that the effects of changes in the Arctic are no longer confined to the region and in fact spread to the mid-latitudes — often in the form of cold weather outbreaks. The group is interested in how effects in the tropics could spread beyond that region and affect the Arctic.
The Paris Agreement adopted in December 2015 during the COP21 conference stipulates that the increase in the global average temperature is to be kept well below 2°C above “pre-industrial levels” and that efforts are pursued to limit the temperature increase to 1.5°C above “pre-industrial levels.” In order to further increase public acceptance of these limits it is important to transparently place the target levels and their baselines in a paleoclimatic context of the past 150,000 years (Last Interglacial, LIG) and in particular of the last 10,000 years (Holocene; Present Interglacial, PIG). Intense paleoclimatological research of the past decade has firmed up that pre-industrial temperatures have been highly variable which needs to be reflected in the pre-industrial climate baseline definitions …
Our charmingly incompetent California Governor, Jerry “Moonbeam” Brown, has announced that all climate-change deniers are “definitely contributing” to the wildfires in the northern and southern parts of the state over the past few days, as well as blazes “in the coming years.” So look out, you dang “deniers”, it’s all your fault!
…
So … did scientists actually “predict” that past temperatures have gone up by one degree? Can scientists actually predict the past? And can we really expect half a degree of warming in the next decade? To get some perspective on these questions, I thought I’d take a look at the records. I found an interesting site, the Western Regional Climate Center (WRCC), which has a variety of weather-related data state by state. So with no further ado, here is the average temperature in California from January of 1895 to the present, October 2018.
by J.C. Maurin, 12 novembre 2018 in ScienceClimatEnergie
L’IPCC (GIEC en français) fut créé en 1988 par l’UNEP (United Nations Environment Programme) et le WMO (World Meteorological Organization). Dans les principes régissant les travaux du GIEC (1) on lit : Le GIEC a pour mission d’évaluer … les risques liés au changement climatique d’origine humaine.Le GIEC respecte son propre principe fondateur : il attribue l’intégralité de la hausse du taux de CO2 depuis 1958 à une cause anthropique. Nous examinerons ici le modèle anthropique du GIEC et nous le confronterons aux mesures contemporaines, puis à un modèle mixte. Cet article fait suite aux deux précédents publiés sur le site SCE au cours des mois de septembre (1/4) et octobre 2018 (2/4).
C. Modèle anthropique GIEC
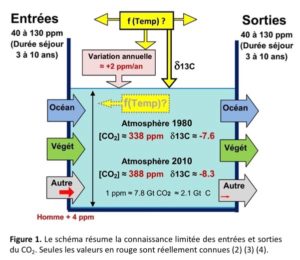
C.1 Les contraintes des modèles (Fig. 1)
Le paragraphe A (article 1/4) a montré qu’en 1980 le taux de CO2 atmosphérique était de 338 ppm et le δ13C de -7.6 ‰. En 2010 le taux de CO2 atmosphérique était de 388 ppm et leδ13C de -8.3 ‰. Il existe une modulation annuelle de ce taux, très marquée dans l’hémisphère Nord.
Des modèles, cela fait 40 ans que j’en fais », précise d’emblée Henri Masson. Ingénieur chimiste de formation (Université Libre de Bruxelles), docteur en sciences appliquées, professeur émérite à l’Université d’Anvers, expert globe-trotter (notamment pour la Banque Mondiale et l’ONU), l’homme est, de surcroît, doté d’un sérieux sens de la vulgarisation. Lorsque Contrepoints lui propose d’analyser les modèles prédictifs du GIEC, le Belge est catégorique : « Si mes étudiants me présentaient de tels modèles, je n’hésiterais pas à les recaler ! »
Contrepoints : Quelle confiance peut-on accorder aux modèles du GIEC, qui prévoient, parmi d’autres choses, un réchauffement planétaire dû aux émissions humaines de CO2 ?
by Bob Weber, November 12, 2018, updated, in HuffingtonPost
There are too many polar bears in parts of Nunavut and climate change hasn’t yet affected any of them, says a draft management plan from the territorial government that contradicts much of conventional scientific thinking.
The proposed plan — which is to go to public hearings in Iqaluit on Tuesday — says that growing bear numbers are increasingly jeopardizing public safety and it’s time Inuit knowledge drove management policy.
“Inuit believe there are now so many bears that public safety has become a major concern,” says the document, the result of four years of study and public consultation.
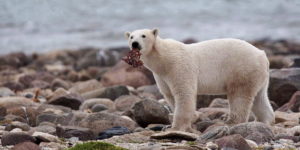
A male polar bear eats a piece of whale meat as it walks along the shore of Hudson Bay near Churchill, Man., on August 23, 2010. New research suggests an answer to the mystery of how polar bears survived previous eras of low sea ice. THE CANADIAN PRESS/Sean Kilpatrick
THE CANADIAN PRESS
A draft plan from the Nunavut government says growing bear numbers are increasingly jeopardizing public safety.
In light of the above findings, Coles et al. state the obvious, that the corals “were able to withstand elevated temperatures (31.4 °C) for a longer period of time in the current 2017 experiment” compared to the 1970 study. Consequently, they conclude that their results “indicate a shift in the temperature threshold tolerance of these corals to a 31-day exposure to 31.4 °C,” which findings “provide the first evidence of coral acclimatization or adaptation to increasing ocean temperatures.” And that observational reality should hold great bearing on the status and health of coral reefs in response to future climate change. If temperatures rise in the future, clearly, as living organisms, corals can (and do!) adapt. Alarmist predictions of their fast and ensuing demise due to global warming should not be taken too seriously.
by J.C. Maurin, 12 novembre 2018 in ScienceClimatEnergie
L’IPCC (GIEC en français) fut créé en 1988 par l’UNEP (United Nations Environment Programme) et le WMO (World Meteorological Organization). Dans les principes régissant les travaux du GIEC (1) on lit : Le GIEC a pour mission d’évaluer … les risques liés au changement climatique d’origine humaine.Le GIEC respecte son propre principe fondateur : il attribue l’intégralité de la hausse du taux de CO2 depuis 1958 à une cause anthropique. Nous examinerons ici le modèle anthropique du GIEC et nous le confronterons aux mesures contemporaines, puis à un modèle mixte. Cet article fait suite aux deux précédents publiés sur le site SCE au cours des mois de septembre (1/4) et octobre 2018 (2/4).
…
C.4. Conclusions
Un modèle qui décrit un monde fixe, en équilibre, un modèle où l’homme est central, un modèle qui parvient à reproduire certaines observations mais pas toutes, un modèle unanimement soutenu par les autorités politiques ou morales, enfin un modèle qui pose a priori un principe intangible… est le type même de modèle qui fut développé par Ptolémée (6) pour le système solaire. Ce modèle fut jadis l’objet d’un consensus à > 97%.
L’atmosphère actuelle comporte environ 20 ppm de CO2 anthropique correspondant à 20/400 soit ≈ 5% du CO2 atmosphérique. En un siècle les hommes ont donc modifié la composition de l’atmosphère de 20 ppm soit 0,002% : sur ce sujet également, il semble que nous ne soyons pas au centre du monde.
Les évolutions récentes du CO2 atmosphérique ne peuvent pas avoir une cause uniquement anthropique: les observations du δ13C l’interdisent. Les causes sont anthropiques et naturelles. Le modèle purement anthropique du GIEC est donc à rejeter.
Regional differences regarding other reconstructions
The results of the study show a temperature rise in the beginning of the Holocene, reaching the highest values in the Holocene Climate Optimum (about 7,800 years ago). There are also high temperatures until about 6,000 years ago, when a decline of temperature started and led to the lowest values in the first stage of the late Holocene (about 4,200 and 2,000 years ago).
Last, researchers detected a rise of temperatures over the two last millenniums, but they state they have to be careful with these data. “We cannot guarantee the observed rise in the reconstruction results from a temperature rise only, we cannot rule out other variables that can influence at other levels, such as the gradual increase of the anthropic activity in the area, which can change the community of Chironomidae to species that adapt to higher temperatures, but there are also human influence indicators,” says Narcís Prat.
Although these conclusions can coincide with other paleoclimate reconstructions, results also highlight some divergences at a regional level. “These differences can occur due the fact that some indicators point out to different seasonal signs. Therefore, Chironomidae are indicators of temperature in summer, while others such as chrysophites or alkenones are related to winter/spring temperatures,” notes the researcher.
by P. Homewood, November 9, 2018 in NotaLotofPeopleKnowThat
What are the environmental impacts? Generally the environmental impact of geothermal developments is extremely low. There are virtually no emissions and land use and visual impact are small. However, some potential impacts do need to be considered and information on each of these issues is set out in the sections below. All these issues will be fully considered as part of the planning process. Cornwall Council has worked with the industry to develop robust Supplementary Planning Guidance to ensure risks are mitigated and minimised. In addition to planning permission, projects must also obtain the necessary licenses from the Environment Agency.
What is the risk of earth tremors (induced seismicity)?
by Liam Denning, November 1, 2018 in BloomberOpinion
The contrast between the success of the U.S. oil and gas industry and unpopularity in the stock market grows ever starker.
The Energy Information Administration released revised monthly figures for U.S. oil production on Thursday. The headline is that production is up — way, way up. It reached 11.35 million barrels a day in August, fully 2.1 million barrels a day higher than a year before. That’s almost like adding a whole new Mexico in the space of 12 months.
A new study, based on 27 years of data from Mana Pools National Park in Zimbabwe, suggests that temperature increases over the last three decades have already caused major declines in local populations of tsetse flies.
This analysis, published in the journal PLOS Medicine this week, provides a first step in linking temperature to the risk of sleeping sickness in Africa.
…
My analysis
A model for fly population mortality is only as good as the temperature data used to run the model. It appears they only used one source of temperature data, the only one available to them, the Rekomitjie Research Station.
Interestingly, this helpful photo was also included in the press release from Eurekalert. It is the weather station used to monitor climate at the Rekomitjie Research Station, Zimbabwe. I provide it below, click for full-size. At the scale displayed above, you might not notice some important details about the weather station itself, but I did. Here it is, magnified: …
“A number of biases internal and external to the scientific community contribute to perpetuating the perception of ocean calamities in the absence of robust evidence.” – Duarte et al., 2015
…
Within a matter of days after the press release for a newly published Naturepaperspewed the usual it’s-worse-than-we-thought headlines throughout the alarmosphere (Washington Post, BBC, New York Times), the paper’s results were assessed to have “major problems” by an author of multiple CO2 climate sensitivity papers (Lewis and Curry, 2015, 2018).
A glaring miscalculation was quickly spotted that changed not only the results, but consequently undermined the conclusion that estimates of climate sensitivity to doubled CO2 may be too low.
And yet the paper was able to pass through peer review anyway.
by Samuel Furfari, 8 novembre 2018 in ConnaissancedesEnergies
Ça y est ! Le seuil de production de 100 millions de barils de pétrole par jour est désormais atteint. Il y a cinquante ans, on en consommait le tiers et c’est une perspective que beaucoup d’experts autoproclamés n’avaient pas envisagé. C’est une nouvelle occasion de répéter, à l’intention de ces « experts » et de ceux qui leur emboîtent le pas, qu’il est temps de cesser la rengaine de la fin du pétrole.
Bien que toutes les annonces passées relatives à la fin du pétrole aient été démenties par les faits, des semeurs de peur s’aventurent encore à lancer ces prévisions fantaisistes. S’ils le font, c’est parce que la peur fait vendre. Tout le monde y trouve son compte: le public reçoit sa dose d’adrénaline – même s’il se plaint du prix prohibitif de son plein de carburant – les auteurs perçoivent leurs droits, les éditeurs vendent des livres ou de la publicité sur leur site internet et des traders actifs à Genève profitent de la situation pour gagner, ne serait-ce que quelques cents en plus, sur les millions de barils de pétrole brut qu’ils négocient.
by P. Homewood, November 8, 2018 in NotaLotofPeopleKnowThat
…
My very first foray into climate blogging was an analysis of extreme weather events in 1971. (I wrote it in 2011, so it was not a cherrypicked year, merely a nice round 40 years before.)
I won’t bore you with it again, as it was basically just a very long list. You can see it here though.
But here is a summary, which goes to show that extreme weather is the norm, not the exception:
The authors evaluate the United Nations Intergovernmental Panel on Climate Change (IPCC) consensus that the increase of carbon dioxide in the Earth’s atmosphere is of anthropogenic origin and is causing dangerous global warming, climate change and climate disruption. The totality of the data available on which that theory is based is evaluated. The data include: (a) Vostok ice-core measurements; (b) accumulation of CO2 in the atmosphere; (c) studies of temperature changes that precede CO2 changes; (d) global temperature trends; (e) current ratio of carbon isotopes in the atmosphere; (f) satellite data for the geographic distribution of atmospheric CO2; (g) effect of solar activity on cosmic rays and cloud cover. Nothing in the data supports the supposition that atmospheric CO2 is a driver of weather or climate, or that human emissions control atmos- pheric CO2.
by J.E. Kamis, November 6, 2018 in ClimateChangeDispatch
Recent research shows that the volume of volcanic CO2 currently being emitted into Earth’s atmosphere is far greater than previously calculated, challenging the validity of the man-made global warming theory.
he cornerstone principle of the global warming theory, anthropogenic global warming (AGW), is built on the premise that significant increases of modern era human-induced CO2 emissions have acted to unnaturally warm Earth’s atmosphere.
A warmed atmosphere that directly, or in some cases indirectly fuels anomalous environmental disasters such as ocean warming, alteration of ocean chemistry, polar ice sheet melting, global sea level rise, coral bleaching and most importantly dramatic changes in climate.
There are numerous major problems with the AGW principle.
Climate variability is a well-known phenomenon and has been frequently, though complex, linked to solar forcing on different time scales. The importance of solar forcing related climate variability is crucial in our understanding of paleoclimate and future climate changes, as well as building climate models. Here in, we present the late Holocene (last ca 1400) climate records from Lake Salda in SW Anatolia using high-resolution micro X-ray Fluorescence (μ-XRF), magnetic susceptibility (MS), stable isotopes (δ13C and δ18O) and TOC-TIC measurements. The age model is constructed by using radionuclide (210Pb, 137Cs and 14C) dating methods. The lake’s high-resolution multiproxy results revealed lake water level fluctuations associated with humid and dry spells during the last 1400 years. Periods of higher lake levels are consistent with solar maxima in total solar irradiance and vice versa. Moreover, the Lake Salda records clearly show dry Dark Ages Cold Period (DACP), humid Medieval Climatic Anomaly (MCA), dry Little Ice Age (LIA), and humid Modern Warm Period (MoWP). These records suggest that the solar forcing, through its influence on the atmospheric circulation, is the main mechanism of climate change during the DACP, MCA, LIA and MoWP in this region.
La géologie, une science plus que passionnante … et diverse
