A Triceratops or Tyrannosaurus rex bulling its way through a pine forest likely dislodged flowers that 100 million years later have been identified in their fossilized form as a new species of tree.
While we obsess about climate change and debate if we live in the Anthropocene, we prepare poorly or not at all for natural forces like volcanoes that can level cities. This is folly we can no longer afford. Experts recommend a simple first step to better protect ourselves. Let’s start listening, or nature will teach us an expensive lesson.
by P Gosselin, August 15, 2017 in ClimateChangeDispatch
Here’s a good example of how climate alarmists and leftists in Germany react when confronted with different opinions or the truth. It just illustrates the brand of radicalism we’re up against.
Future Global Warming Scenarios ‘Potentially Beneficial’, Cooling May Cause Ecological ‘Declines’ / Human Health Risks ‘Extremely Sensitive’ To Temperature, With Cold Temperatures More Dangerous/Mass Extinctions Caused By Cold Temperatures (Ice Ages), Not Global Warming/ …
Specifically the Bureau of Land Management Health Risk Evaluation for Cabon Dioxyde points out:
A value of 40,000 ppm is considered immediately dangerous to life and health based on the fact that a 30-minute exposure to 50,000 ppm produces intoxication, and concentrations greater than that (7-10%) produce unconsciousness (NIOSH 1996; Tox. Review 2005). Additionally, acute toxicity data show the lethal concentration low (LCLo) for CO2 is 90,000 ppm (9%) over 5 minutes (NIOSH 1996).
by Paul Matthews, August 13, 2017 in CimateScepticism
In many ways, the climate debate has hardly changed since I got interested in it about ten years ago. Public opinion wobbles up and down with hardly any real change. The same tired arguments and claims come round again: every climate conference is the last chance to save the planet; the Arctic ice is always about to vanish in one or two years, or ten years; climate scientists continue to be accused of selecting data sets to create hockeysticks and manipulating data; and teams of climate scientists keep producing reports saying almost exactly the same thing as the previous reports, which then get misrepresented and hyped by the media.
The Edinburgh volcano survey, reported in the Geological Society’s special publications series, involved studying the underside of the west Antarctica ice sheet for hidden peaks of basalt rock similar to those produced by the region’s other volcanoes. Their tips actually lie above the ice and have been spotted by polar explorers over the past century.
In this study we investigate statistical link between external climate forcings and modes of ocean variability on inter-annual (3-year) to centennial (100-year) timescales using de-trended semi-partial-cross-correlation analysis technique. To investigate this link we employ observations (AD 1854–1999), climate proxies (AD 1600–1999), and coupled Atmosphere-Ocean-Chemistry Climate Model simulations with SOCOL-MPIOM (AD 1600–1999). We find robust statistical evidence that Atlantic multi-decadal oscillation (AMO) has intrinsic positive correlation with solar activity in all datasets employed. The strength of the relationship between AMO and solar activity is modulated by volcanic eruptions and complex interaction among modes of ocean variability.
Agricultural and wetland emissions” from the planet’s tropical areas, not oil and gas activities in the United States, are more than likely responsible for a post-2007 global increase in methane levels, according to the National Oceanic and Atmospheric Administration’s Climate.gov.
Five million years ago, average temperatures were higher than they are now. During the Pliocene, the era just before the period of the Quaternary Ice Ages, ‘glacials’ did not yet exist because temperatures were too high. As cooling of the deep seas continued, temperatures became that low that large surfaces of the Northern Hemisphere became covered with snow. The earth’s albedo grew fast and large ice sheets started to develop
“Deficiencies in the accuracy, quality and continuity of the records,” that “place serious limitations on the confidence that can be placed in the research results.”
The people who reached these conclusions and their affiliations at the time follows.
by Kenneth Richard, August 7, 2017 in NoTricksZone reposted Paul Homewood
In recent months, two new papers published in The Cryosphere have provided a condensed summary of the ice-melt and sea-level-rise consequences of global warming for the Arctic region.
1. Between 1900 and 2010, the Greenland Ice Sheet (GIS) has melted so extensively and so rapidly that the GIS ice-melt contribution to global sea level rise has amounted to 1.5 centimeters for the entire 110-year period. One-and-a-half centimeters. That’s 0.59 of an inch!
2. It gets worse. Between 1993 and 2010, the contribution to global sea level rise has been a disturbing 0.39 of a centimeter. Almost 4/10ths of a centimeter. That’s 0.15 of an inch!
The world is presently in an era of unusually low weather disasters. This holds for the weather phenomena that have historically caused the most damage: tropical cyclones, floods, tornadoes and drought. Given how weather events have become politicized in debates over climate change, some find this hard to believe. Fortunately, government and IPCC (Intergovernmental Panel on Climate Change) analyses allow such claims to be adjudicated based on science, and not politics. Here I briefly summarize recent relevant data.
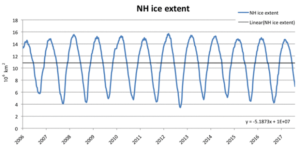
In sharp contrast with previous decades, the past 10 years have seen no change in Northern Hemisphere average sea ice extent, according to MASIE (may-zee, Multi-sensor Analyzed Sea Ice Extent) database from the National Sea & Ice Data Center (NSIDC; see figure 1).
“With the decline of North Sea gas and our ever increasing reliance on gas imports, including shale gas imported from the United States, developing an indigenous source of natural gas is critical for U.K. energy security, our economy, jobs and the environment,” Cuadrilla CEO Francis Egan said in a statement. “We are proud as a Lancashire company to be at the forefront of that effort.
I mentioned in my previous post that the latest draft climate report, published in June, had seemingly left out a rather embarrassing table from the Executive Summary, one that had previously been written into the Third Draft, published last December.
As the link to the Third Draft had disappeared from the NYT, I could not show it.
However, Michael Bastasch, writing over at WUWT, did have the link, so we can now compare the relevant sections.
The report was completed this year and is a special science section of the National Climate Assessment, which is congressionally mandated every four years. The National Academy of Sciences has signed off on the draft report, and the authors are awaiting permission from the Trump administration to release it.
NYT Admits Its Front Page Climate Change Article Was Wrong, seehere
‘Pre-determined science’ Morano reacts to NYT’s ‘leaked’ federal climate doom report: ‘Political report masquerading as science’, see here
Earth’s most severe mass extinction, the “Great Dying,” began 251.94 million years ago at the end of the Permian period, with the loss of more than 90% of marine species. Precise rock dates published in 2014 and 2015 proved that the extinction coincided with the Siberian Traps LIP, an epic outpouring of lava and intrusions of underground magma covering an area of northern Asia the size of Europe.
But those rock dates presented science with a new puzzle: why was the mass extinction event much shorter than the eruptions? And why did the extinction happen some 300,000 years after the lava began to flow?
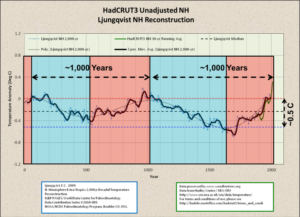
The Bray cycle is about 2450 years from beginning to end and the Bray Lows, which are the coldest portion of the cycle, are the most important events.
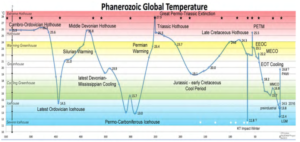
The world is currently within the Quaternary Ice Age and nearly as cold as it has ever been. The normal average temperature of the world is around 20°C, some 5°C warmer than today. To keep recent warming in perspective, it is important to understand that even if the worse predictions of the IPCC were to occur, we would only be returning to the average temperature of the last 560 million years
Earlier studies had documented little change in the western Ross coastline prior to 1995, and the new study both confirmed the earlier work and extended the analysis to the present time.
This work underscores the complexity of Antarctic climate change and glacier response.
Prof. Quansheng Ge and his group from the Institute of Geographic Sciences and Natural Resources Research, Chinese Academy of Sciences, collected a large number of proxies and reconstructed a 2000-year temperature series in China with a 10-year resolution, enabling them to quantitatively reveal the characteristics of temperature change in China over a common era.
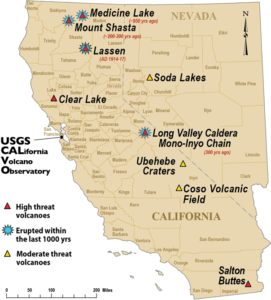
Since 1600, 278,880 people have been killed by volcanic activity, with many of these deaths attributed to secondary hazards associated with the main eruption. Starvation killed 92,000 following the 1815 Tambora eruption in Indonesia, for example, and a volcanic tsunami killed 36,000 following the 1883 Krakatoa eruption.
Research shows that volcanic activity has shown no let up since the turn of the 21st century – it just hasn’t been around population centres. Indeed, there remain a number of volcanoes poised to blow which pose a major threat to life and livelihood.
Le Venezuela se trouve à la croisée des chemins. Se dirige-t-il vers le modernisme ou va-t-il poursuivre sa révolution bolivarienne vers le socialisme qui l’a conduit à la débâcle à laquelle nous assistons aujourd’hui ?
Le pays possède tout ce qu’il faut pour connaitre la prospérité et la paix. Ses abondantes ressources d’hydrocarbures auraient pu en faire la Norvège de l’Amérique latine
So… If climate change caused the Vikings to turn their plowshares into swords, abandoning their farms to become terrorists… the climate change would have been of the warming variety. I’m not a farmer, but it seems to me that global warming would have actually enhanced the Vikings’ ability to farm up around the Arctic Circle.
La géologie, une science plus que passionnante … et diverse