Watching the current maps and models, it appears the 2019 Atlantic Hurricane Season is off to a slow start. For people that the depend on disaster porn (climate alarmists, media) that means no weather events to claim as being climate driven.
…
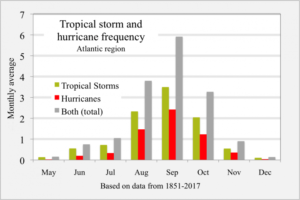
Graph of tropical storm and hurricane frequency, Atlantic region, monthly, based on data from 1851-2017. Data from NOAA at http://www.aoml.noaa.gov/hrd/tcfaq/E17.html Landsea, Chris (contributor from the NHC). “Total and Average Number of Tropical Cylones by Month (1851-2017)”. aoml.noaa.gov. National Oceanic and Atmospheric Administration, Atlantic Oceanographic and Meteorological Laboratory. Archived from the original on September 1, 2018. Graph from RCraig.
…
La géologie, une science plus que passionnante … et diverse