
by Anthony Watts, March 22, 2019 in WUWT/BjornLomborg
Bjorn Lomborg writes on Twitter:
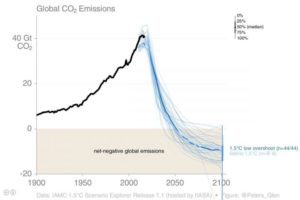
“Wishful thinking: This graph starkly shows what power the 1.5°C target The black line is CO₂ emission increase last 118 years (last year was highest ever) The blue lines indicate the emissions necessary to ensure the widely politically agreed 1.5°C limit”.
…