by P. Gosselin, March 2, 2019 in NoTricksZone
Japan winters are cooling
The Pacific island nation of Japan refuses to obey climate scientists’ forecasts of warming and ignore climate alarmists and their chorus of doomsday shrieks. Climate trends are moving the other way.
Now that February has ended, the 2018/19 winter is now in the books. We’ve tabulated the winter temperature data for Japan going back 32 years. The following chart tells a story that was not supposed to happen:
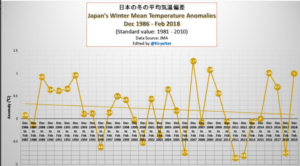
Japan’s mean winter temperature has been falling for more than 30 years, according to the data from the Japan Meteorology Agency (JMA).
While alarmists insist it’s heating up everywhere, the reality is actually just the opposite, and not just in Japan.
Finland is cooling
The Scandinavian country of Finland, which extends up into the Arctic, also shows no signs of warming at all since December, 1988.
…
by Ross McKitrick, March1, 2019 in WUWT
Ben Santer et al. have a new paper out in Nature Climate Change arguing that with 40 years of satellite data available they can detect the anthropogenic influence in the mid-troposphere at a 5-sigma level of confidence. This, they point out, is the “gold standard” of proof in particle physics, even invoking for comparison the Higgs boson discovery in their Supplementary information.
…
…
Conclusion
The fact that in my example the t-statistic on anthro falls to a low level does not “prove” that anthropogenic forcing has no effect on tropospheric temperatures. It does show that in the framework of my model the effects are not statistically significant. If you think the model is correctly-specified and the data set is appropriate you will have reason to accept the result, at least provisionally. If you have reason to doubt the correctness of the specification then you are not obliged to accept the result.
This is the nature of evidence from statistical modeling: it is contingent on the specification and assumptions. In my view the second regression is a more valid specification than the first one, so faced with a choice between the two, the second set of results is more valid. But there may be other, more valid specifications that yield different results.
In the same way, since I have reason to doubt the validity of the Santer et al. model I don’t accept their conclusions. They haven’t shown what they say they showed. In particular they have not identified a unique anthropogenic fingerprint, or provided a credible control for natural variability over the sample period. Nor have they justified the use of Gaussian p-values. Their claim to have attained a “gold standard” of proof are unwarranted, in part because statistical modeling can never do that, and in part because of the specific problems in their model.
by Jean, N. 2 mars 5019 in ScienceClimatEnergie
Comme déjà mentionné dans un article précédent publié sur SCE, la variation de la couverture nuageuse a probablement un effet majeur sur la température moyenne globale de la basse atmosphère. Si l’on veut prédire le climat du futur comme le prétend le GIEC il faut savoir modéliser la formation des nuages. Que nous dit le dernier rapport scientifique (AR5) du GIEC à ce sujet? Le but du présent article est simplement de vous présenter quelques phrases tirées de ce rapport. La science est-elle dite?
1. Le chapitre 7 du rapport AR5 publié par le GIEC en 2013
Le chapitre 7 du rapport AR5 du GIEC[1] fait 60 pages et est consacré aux nuages et aux aérosols (le rapport AR5 complet fait au total 1535 pages). Ce chapitre 7 comporte 22 pages de références et cite plus de 1100 articles scientifiques publiés dans des revues aussi prestigieuses que Science, Nature ou PNAS. Le chapitre 7 a été écrit sous la direction de Olivier Boucher (France) et David Randall (USA), deux spécialistes du domaine. Nous n’allons pas ici remettre en question la validité de ce chapitre. Nous allons simplement vous présenter quelques phrases tirées du rapport. Comme le rapport est écrit en anglais nous vous proposerons ci-dessous une “traduction maison” des phrases qui nous paraissent les plus importantes, assorties parfois de quelques explications pour bien les comprendre. Les lettres entre crochets ([A] à [P]) renvoient simplement au texte original en anglais, donné en Annexe du présent article.
…
La géologie, une science plus que passionnante … et diverse
